Features
Hydrology
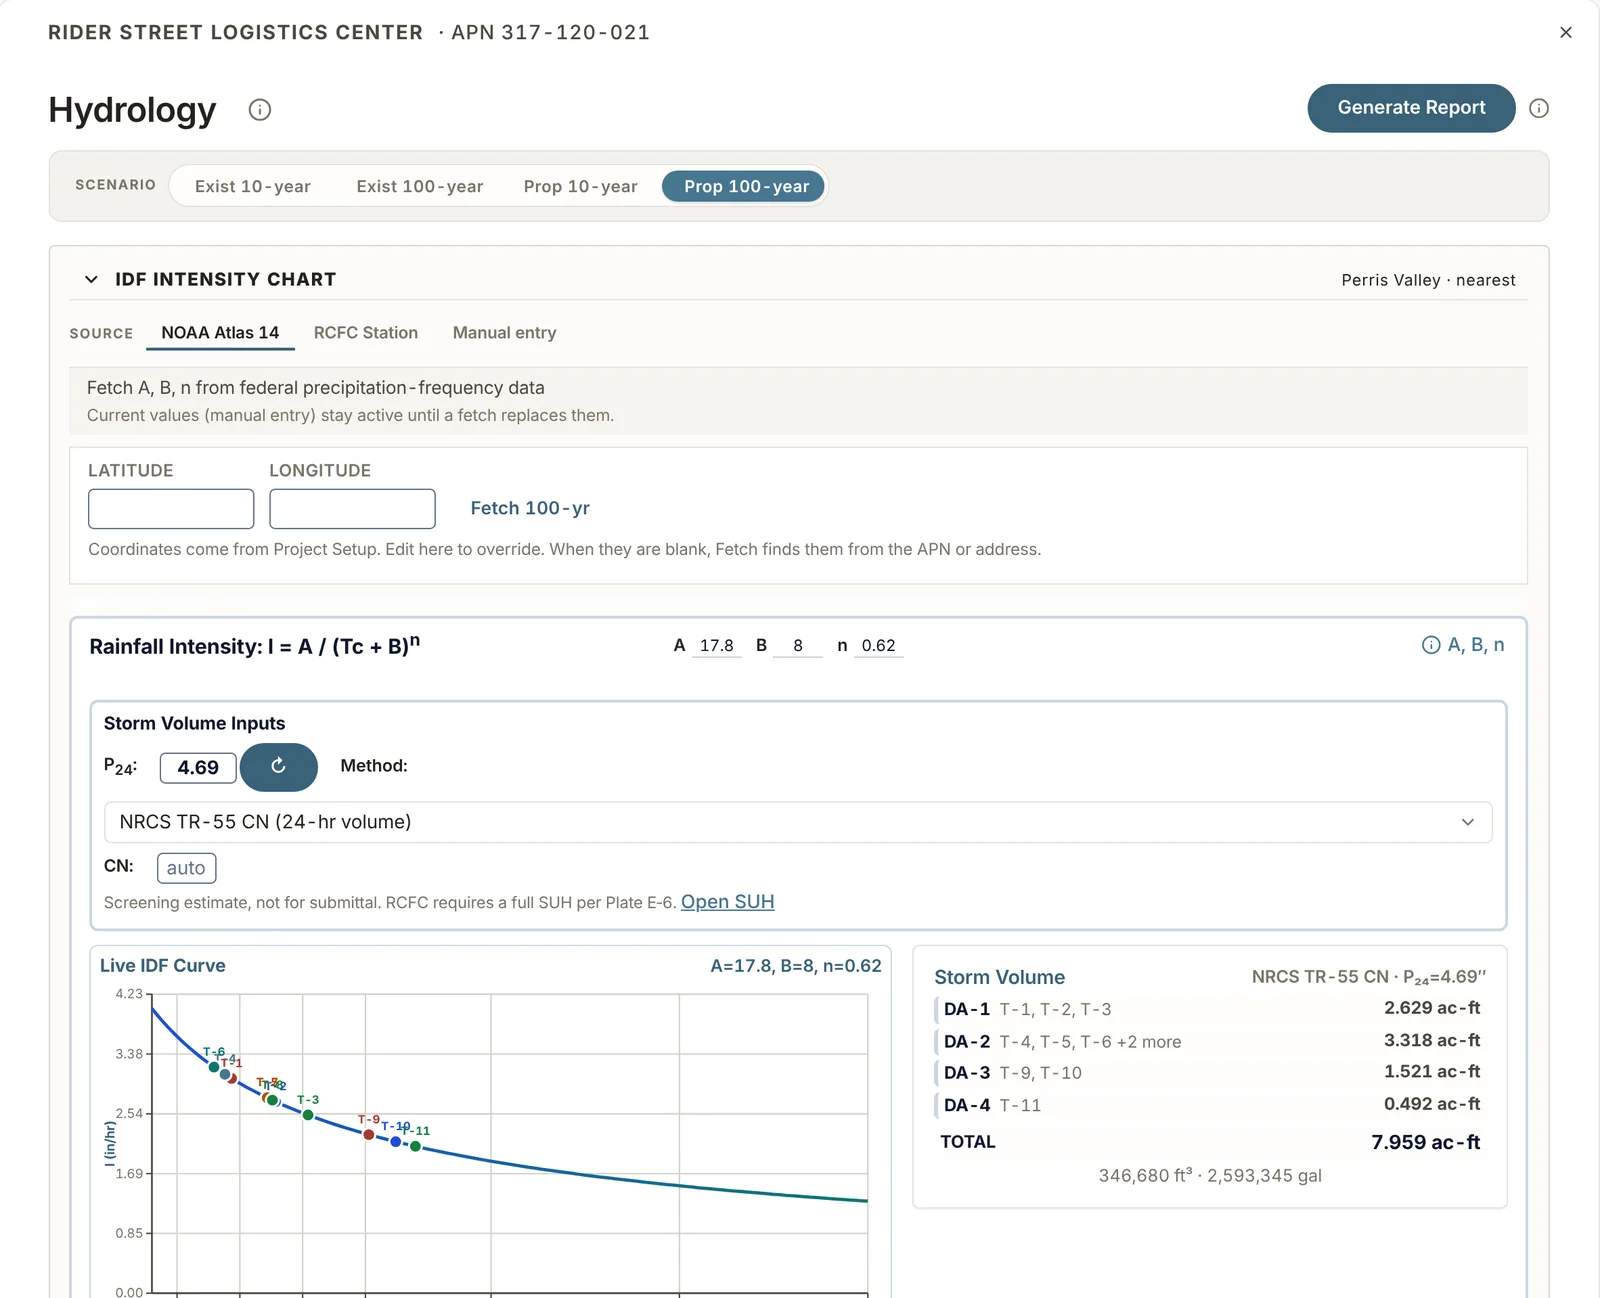
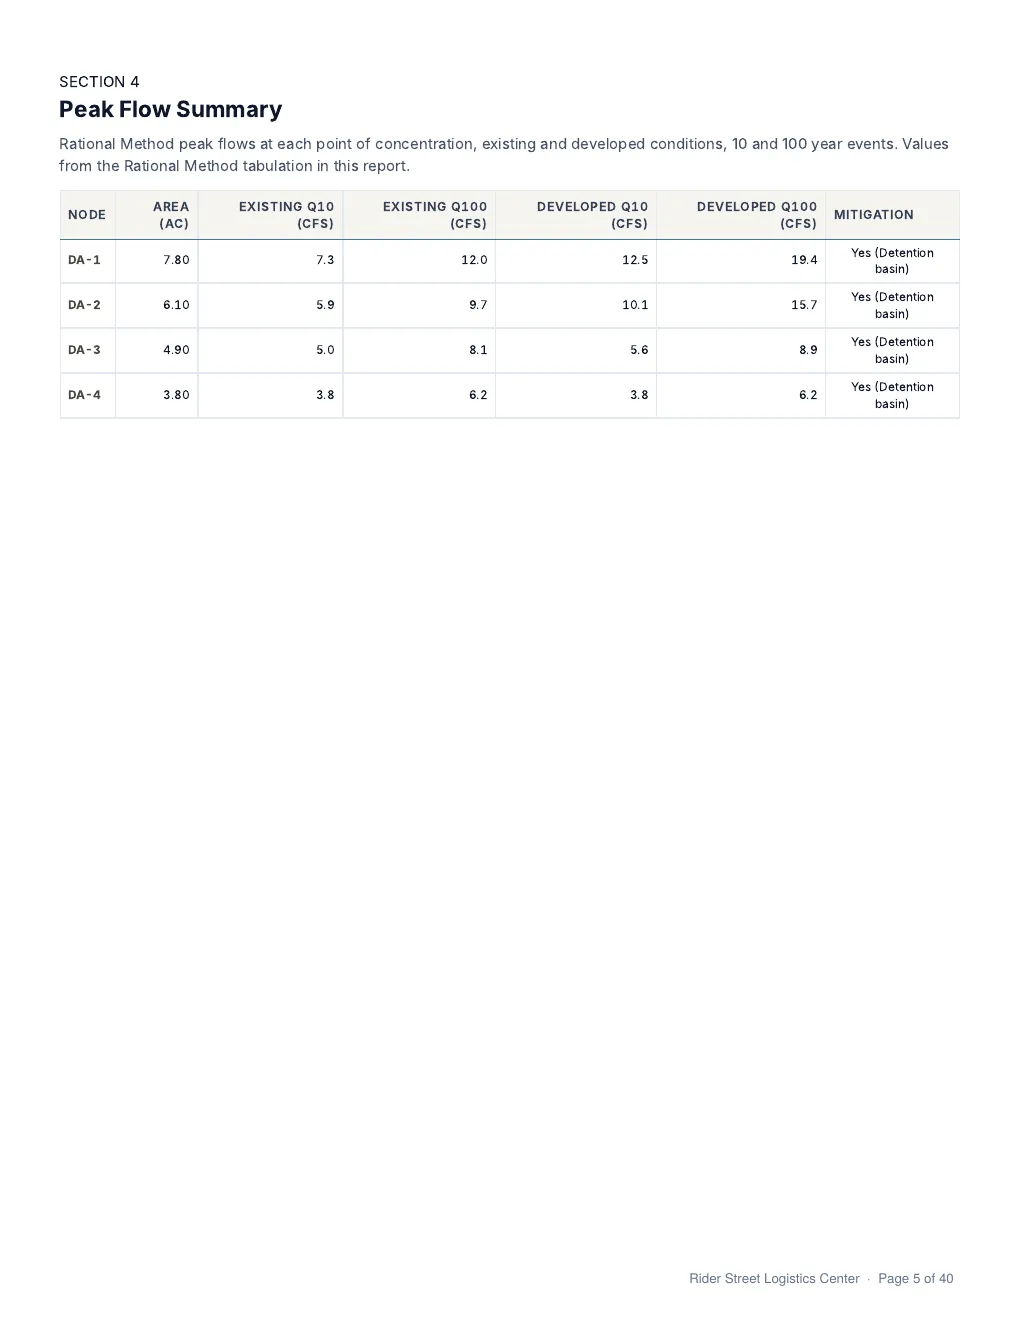
Peak flows by the Rational Method and storm runoff volumes, for existing and proposed conditions.
Rainfall
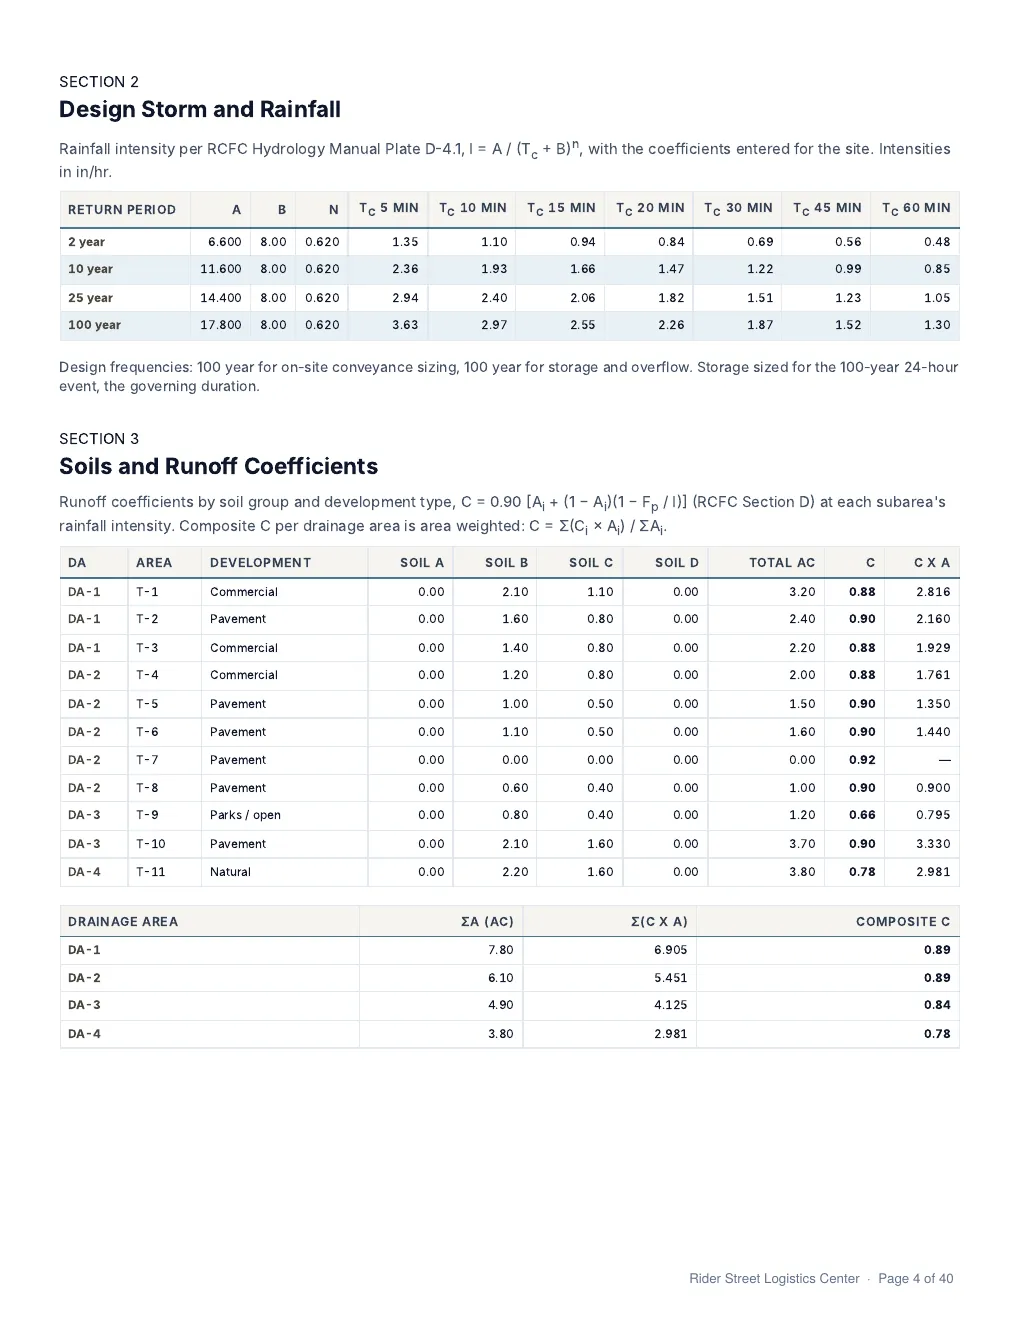
- NOAA Atlas 14 depths are downloaded for the site coordinates.
- In Riverside County, the nearest RCFC Plate D-4.1 rain gauge station can be used instead.
- The intensity coefficients A, B and n can also be entered by hand.
County methods
- Riverside: RCFC Hydrology Manual.
- San Bernardino: County Hydrology Manual, Chapter 4.
- Orange: County Hydrology Manual, Section D.
- San Diego: County Hydrology Manual, Section 3.
- Los Angeles: County Hydrology Manual, Section 12.2.
Tributary areas
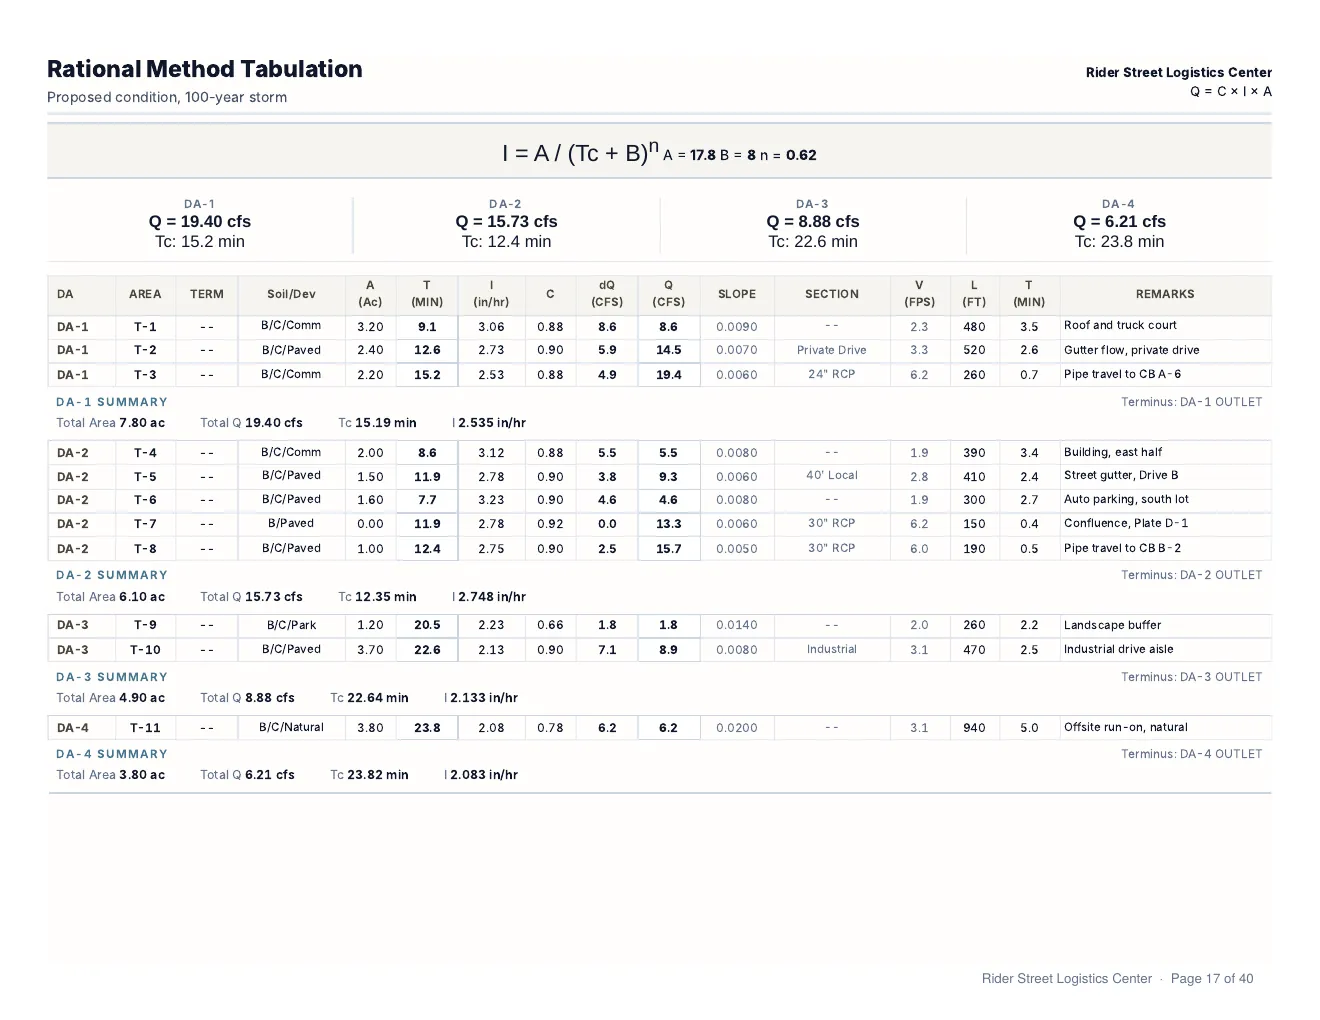
- Initial areas, subareas and confluences are entered in one table.
- The runoff coefficient comes from the soil groups and development type.
- Travel time is calculated through streets, drives and pipes.
- Confluences are combined per RCFC Plate D-1.
- Each scenario, existing or proposed, has its own table.
Storm volume
- Volumes by the NRCS curve number method or the RCFC volumetric method.
- Synthetic unit hydrographs for the 3, 6 and 24-hour storms.
- HCOC assessment, WQMP Form 4.2-3.
Report pages
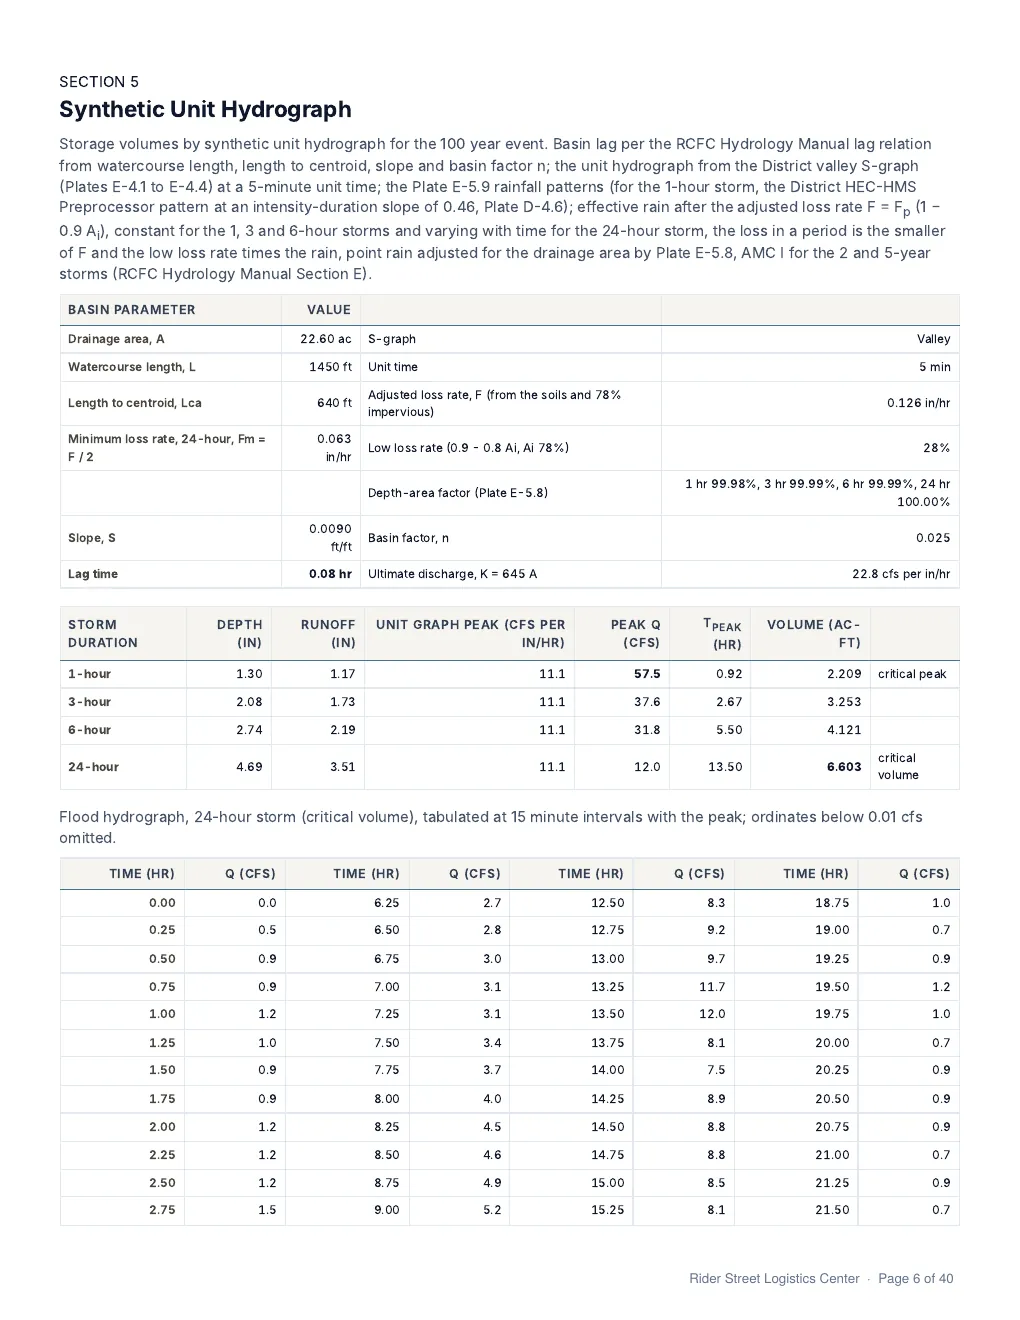
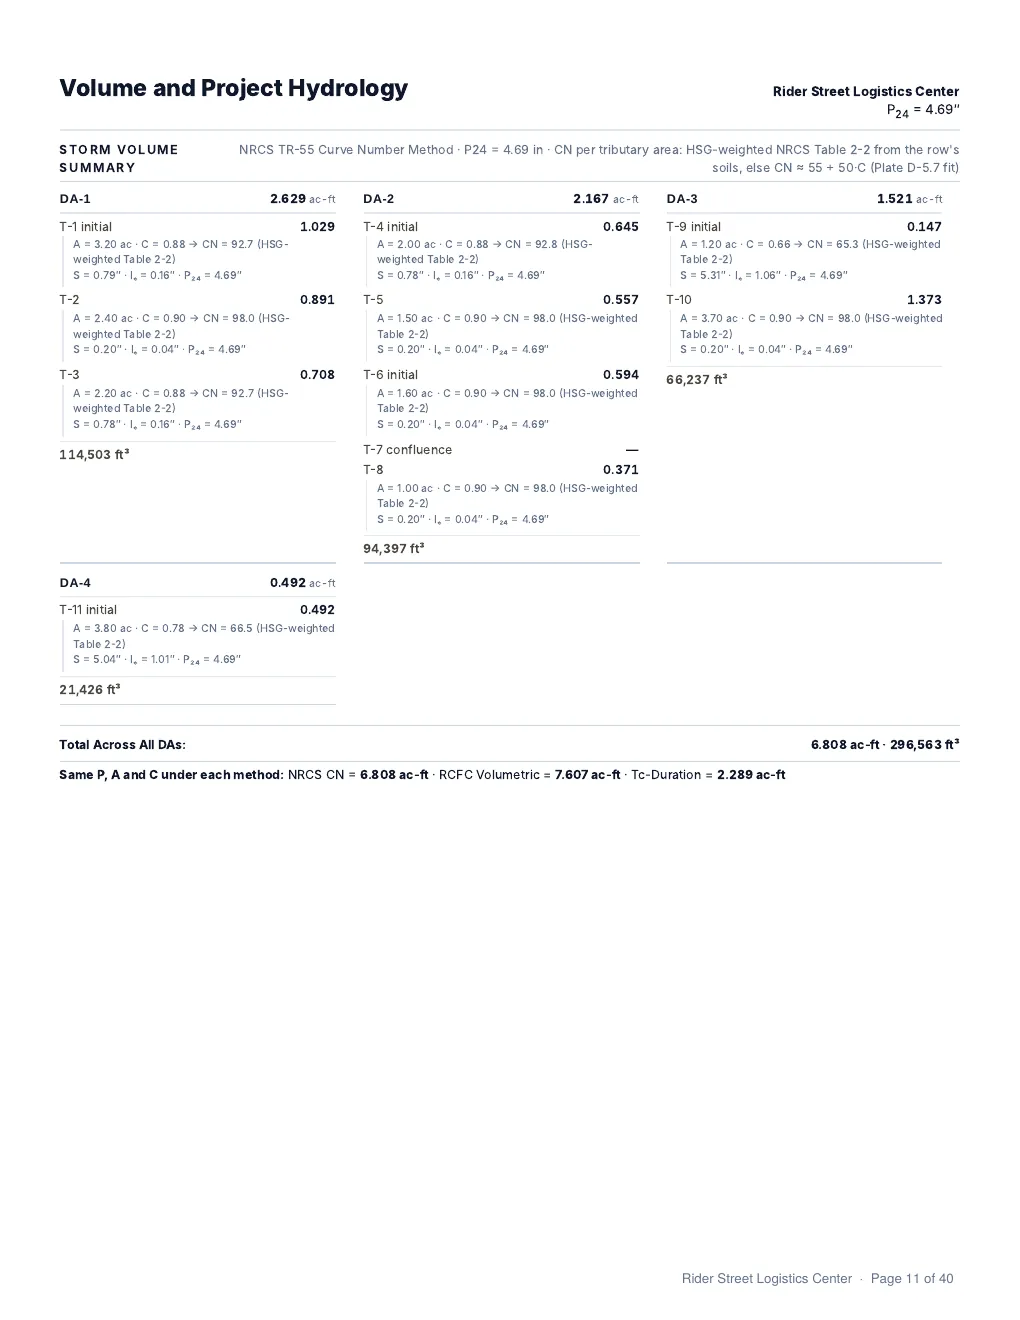
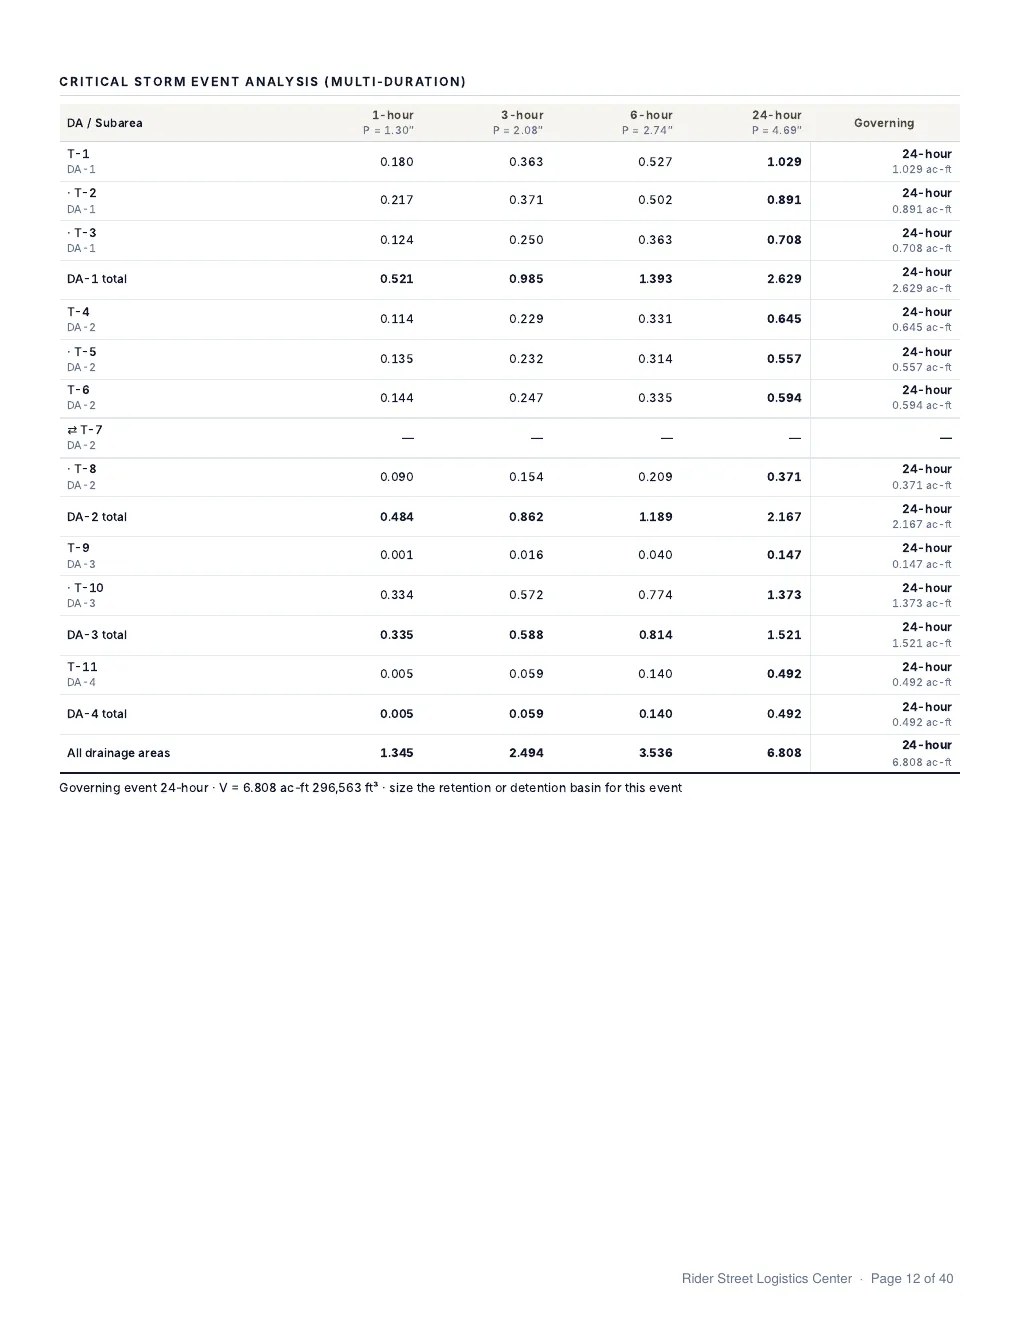
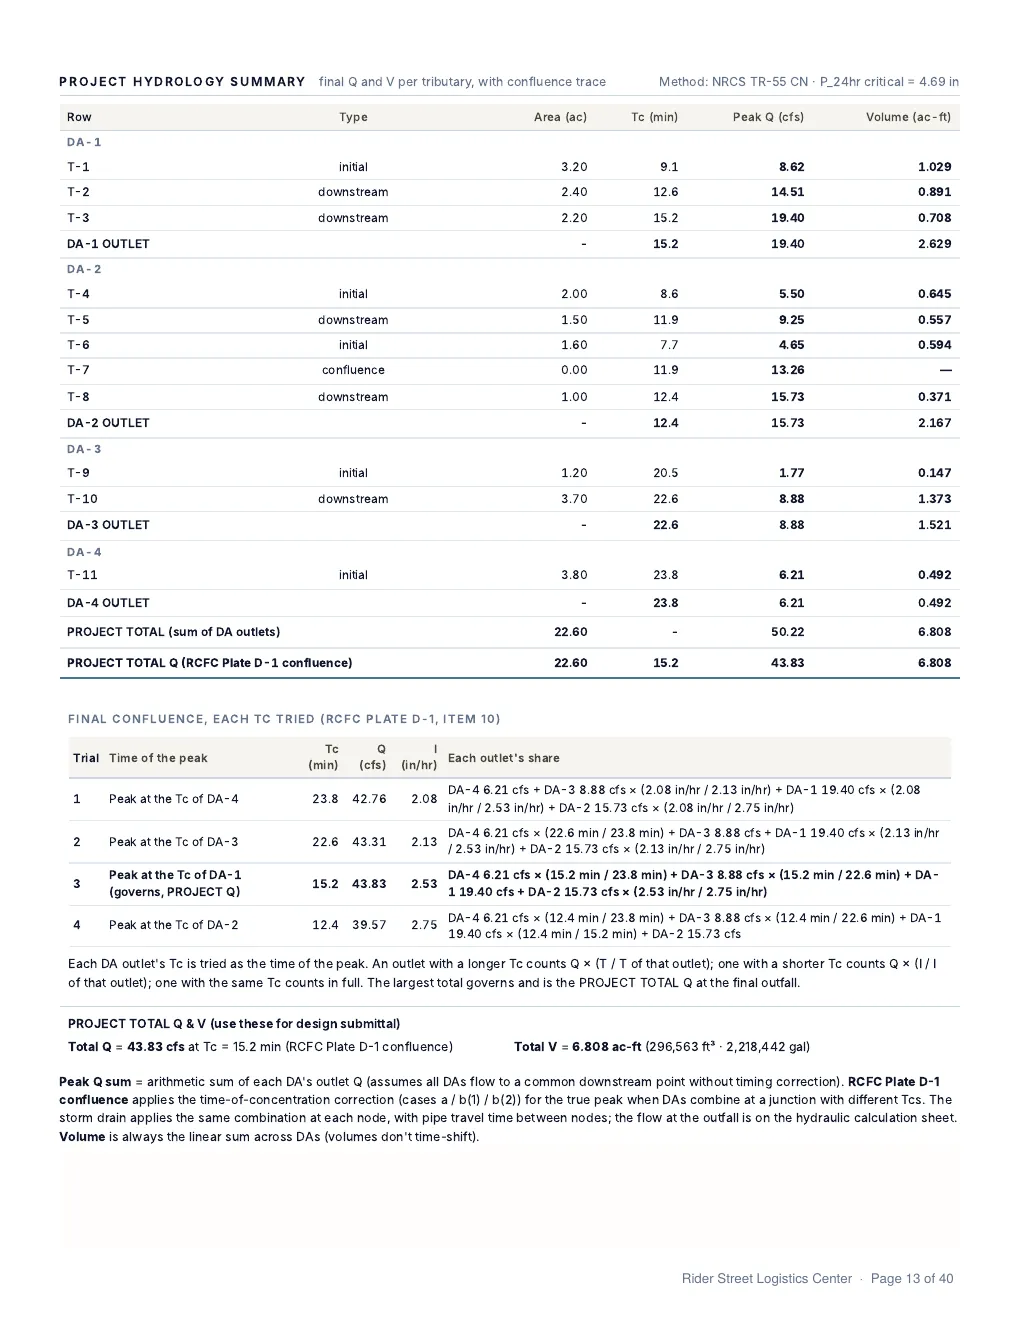
Stormwater
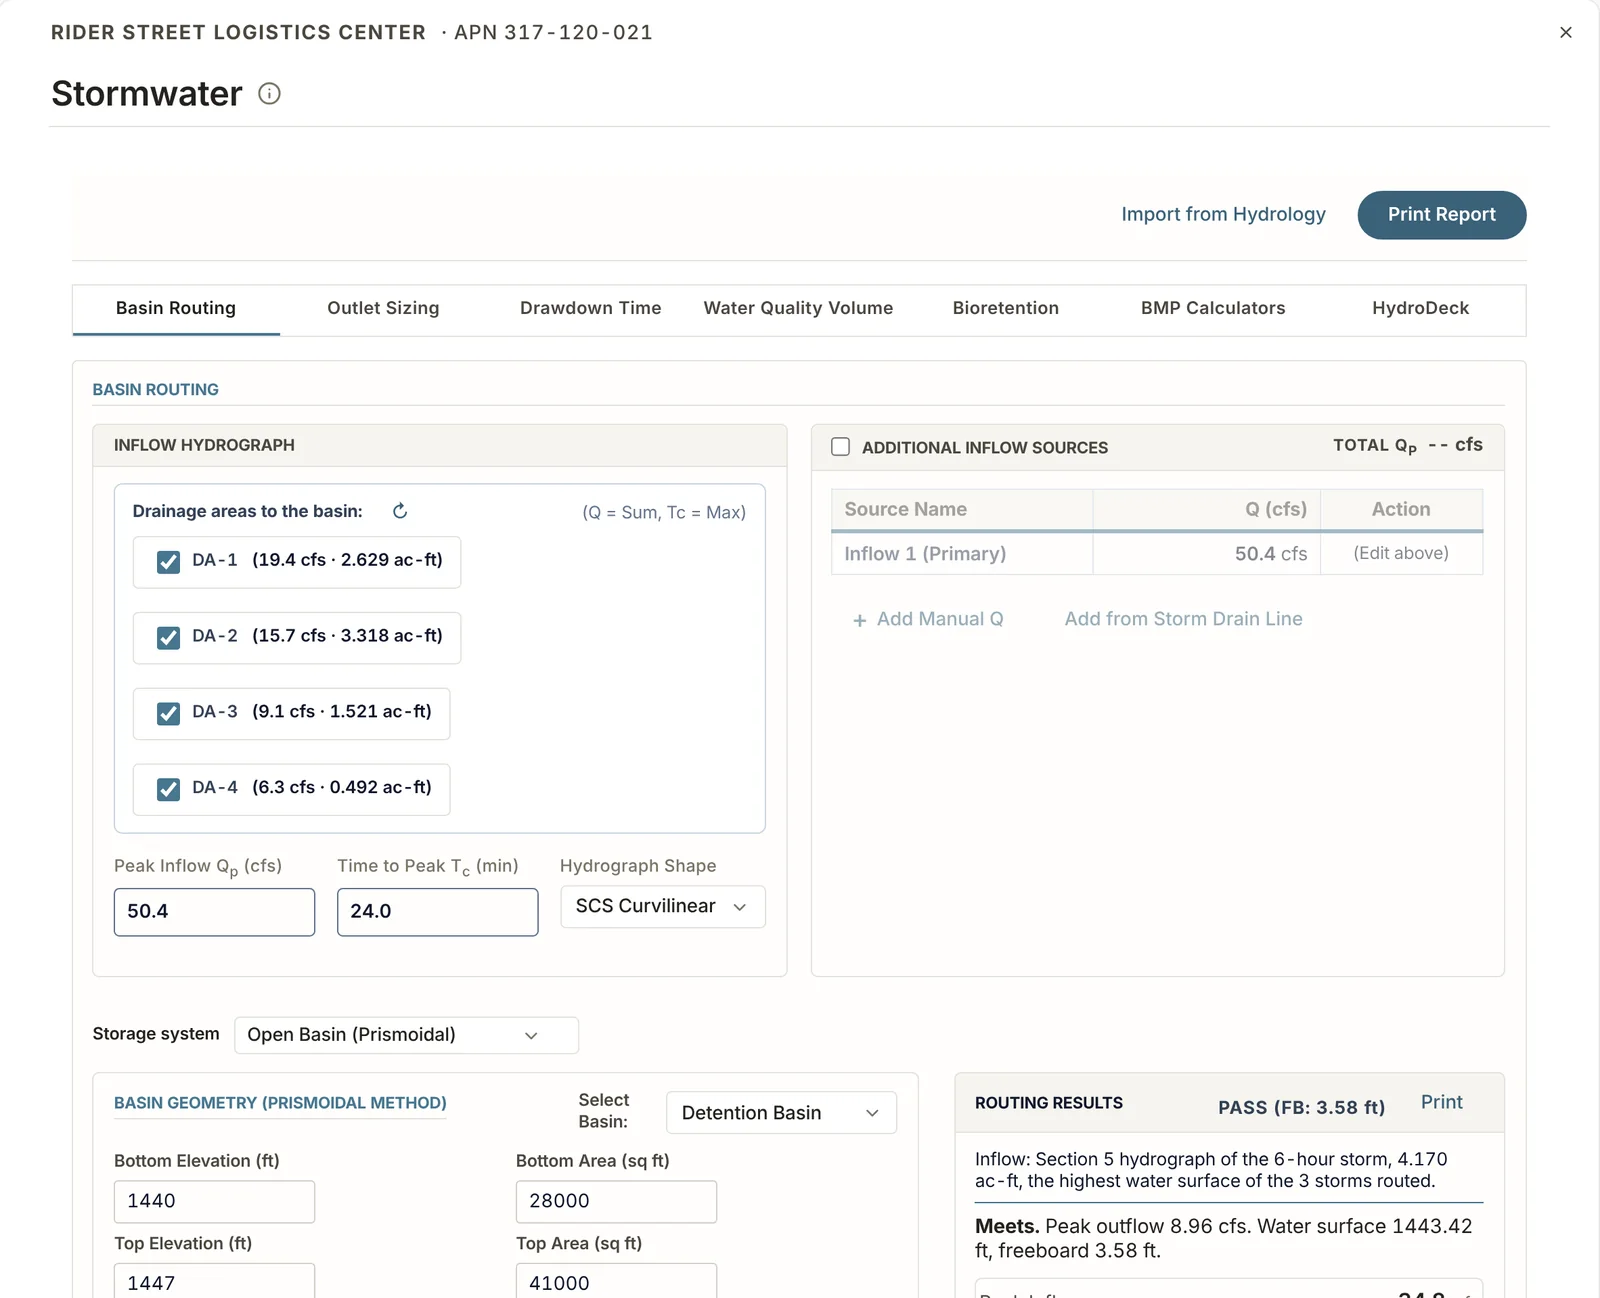
Sizing for basins and other storage: routing, outlets, drawdown time and water quality volume.
Basin routing
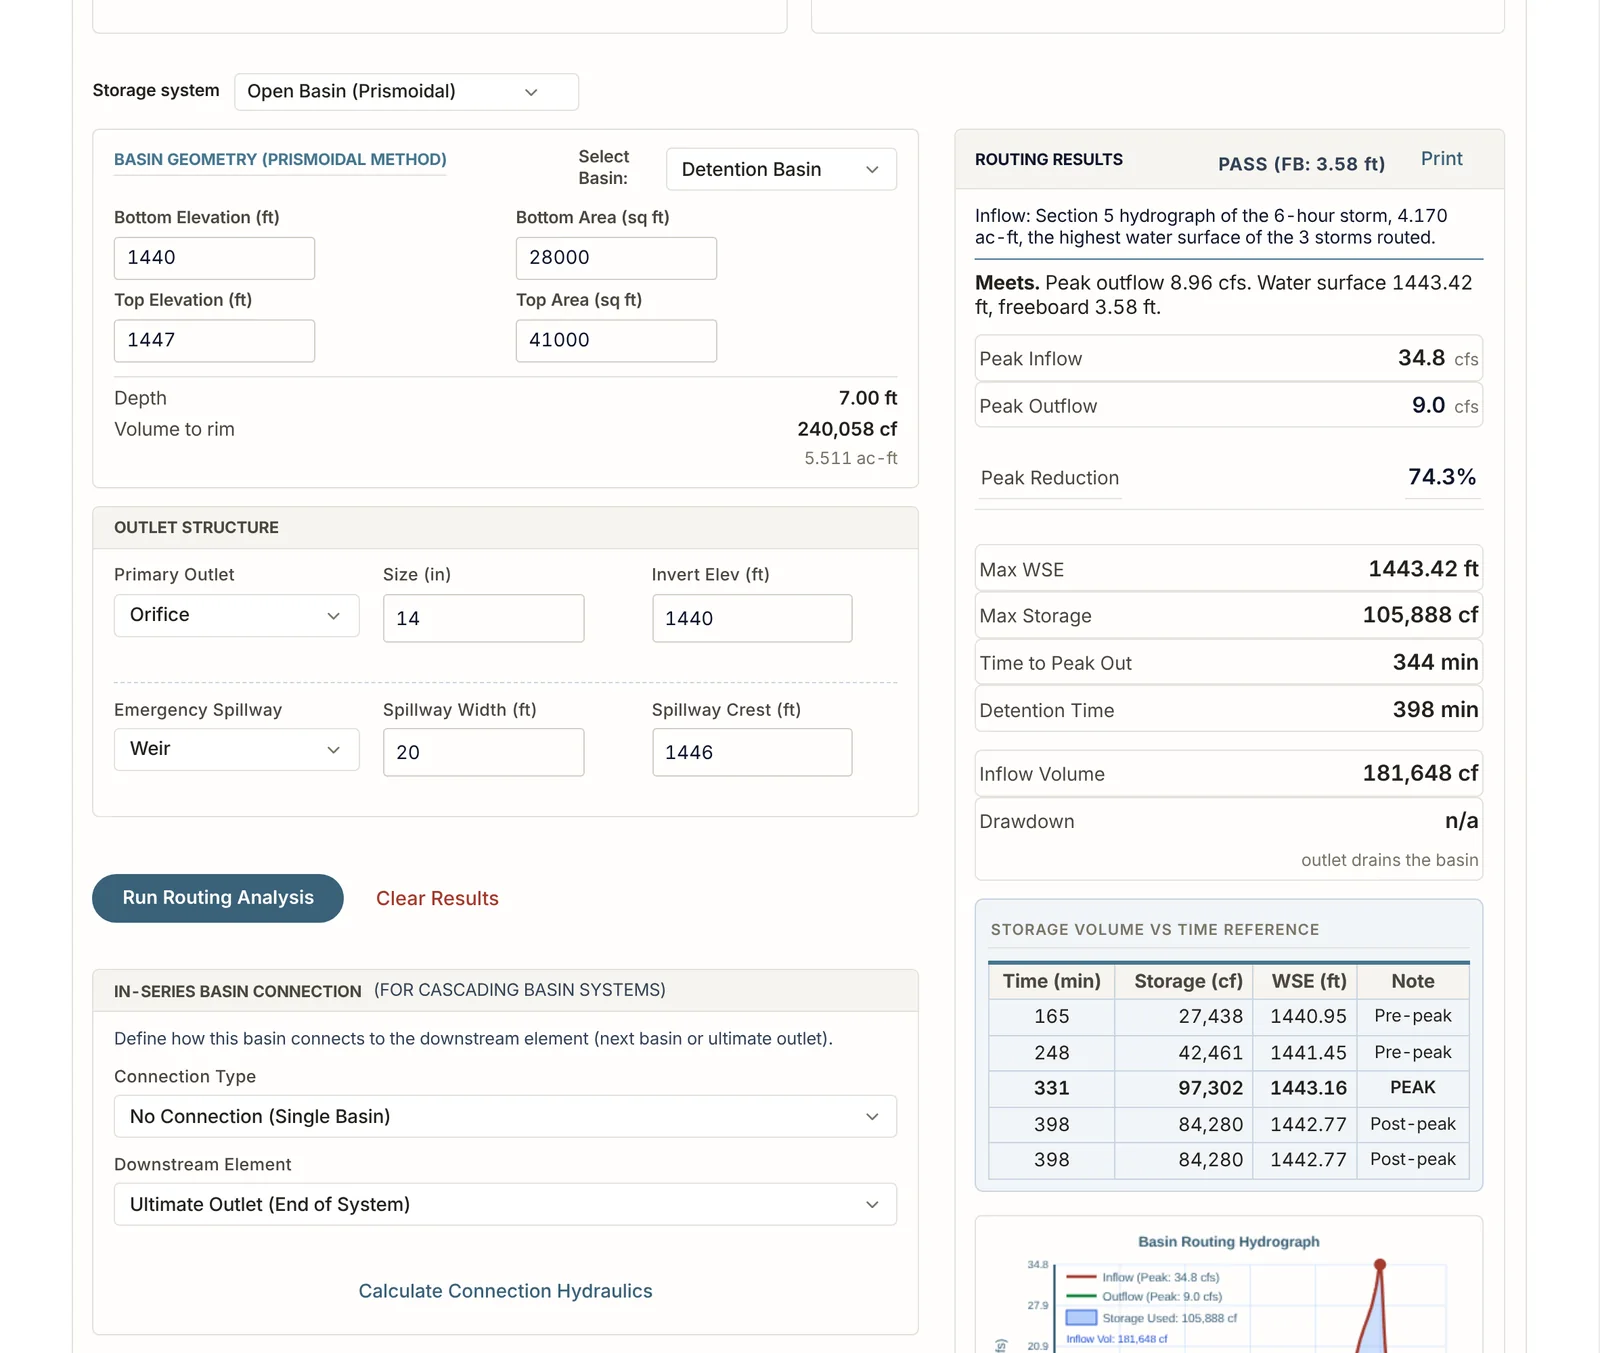
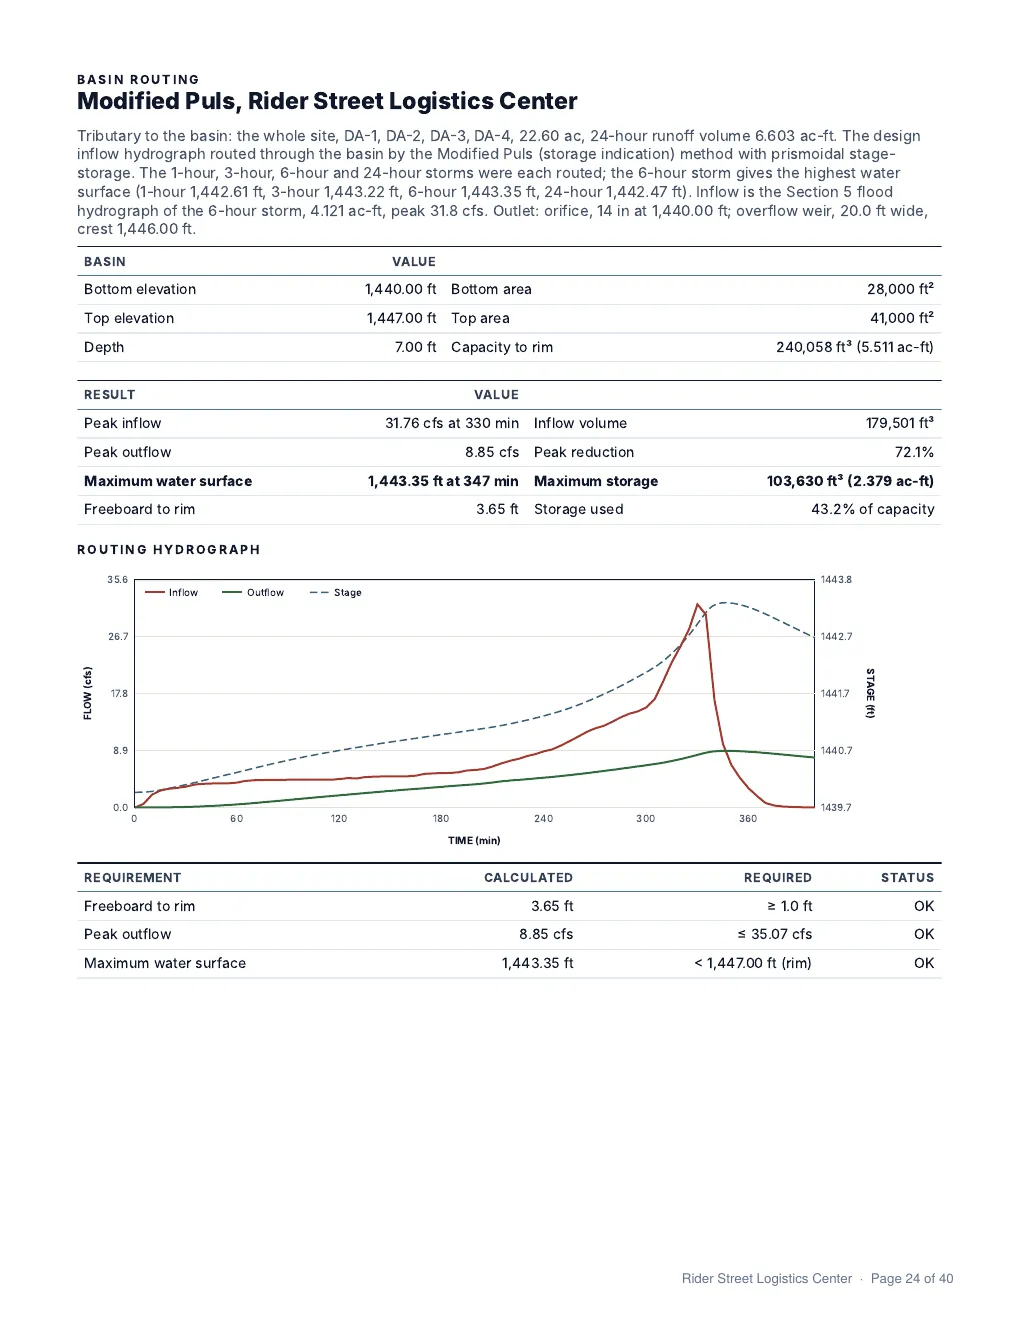
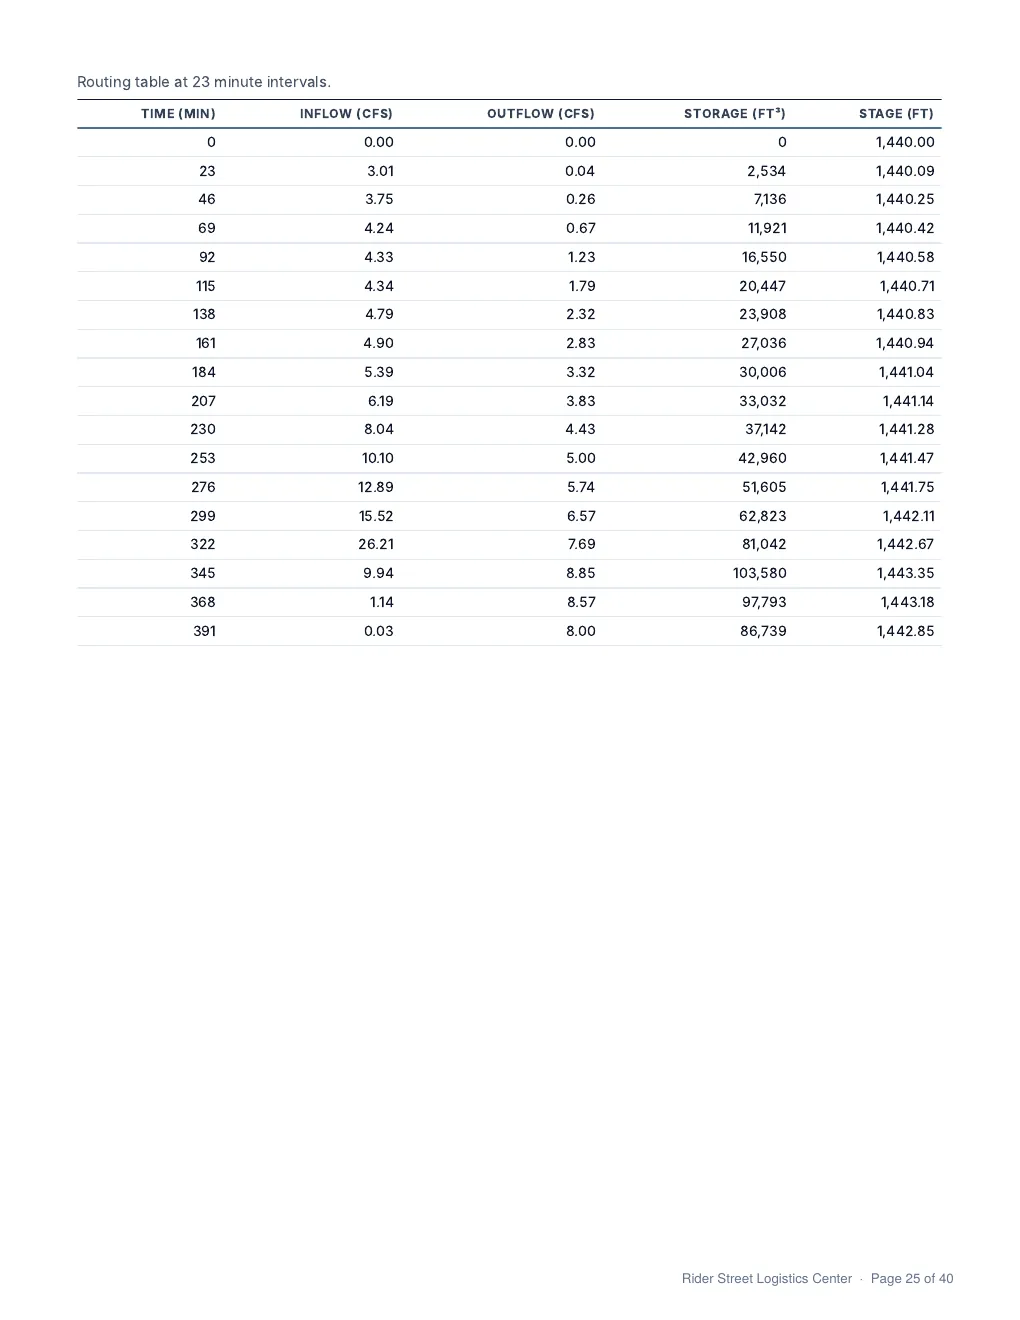
- Routes the 3, 6 and 24-hour storms and keeps the one with the highest water surface.
- Results list peak inflow, peak outflow, maximum water surface, storage used and freeboard.
- Freeboard is checked at 1.0 ft for a basin with an outlet and 0.5 ft for a retention basin.
- Peak outflow is compared with the existing condition peak flow.
- A multi-storm run routes the 2, 10, 25 and 100-year storms.
Outlets
- Circular and rectangular orifices, sharp and broad-crested weirs, and V-notch weirs.
- Size an outlet for a target flow, or get the flow for a given size.
- Emergency spillway width and crest.
Other calculations
- Drawdown time.
- Water quality volume for the 85th percentile storm.
- Bioretention.
- CMP retention, drywells and permeable pavers.
- HydroDeck underground storage.
Report pages
Storm Drain
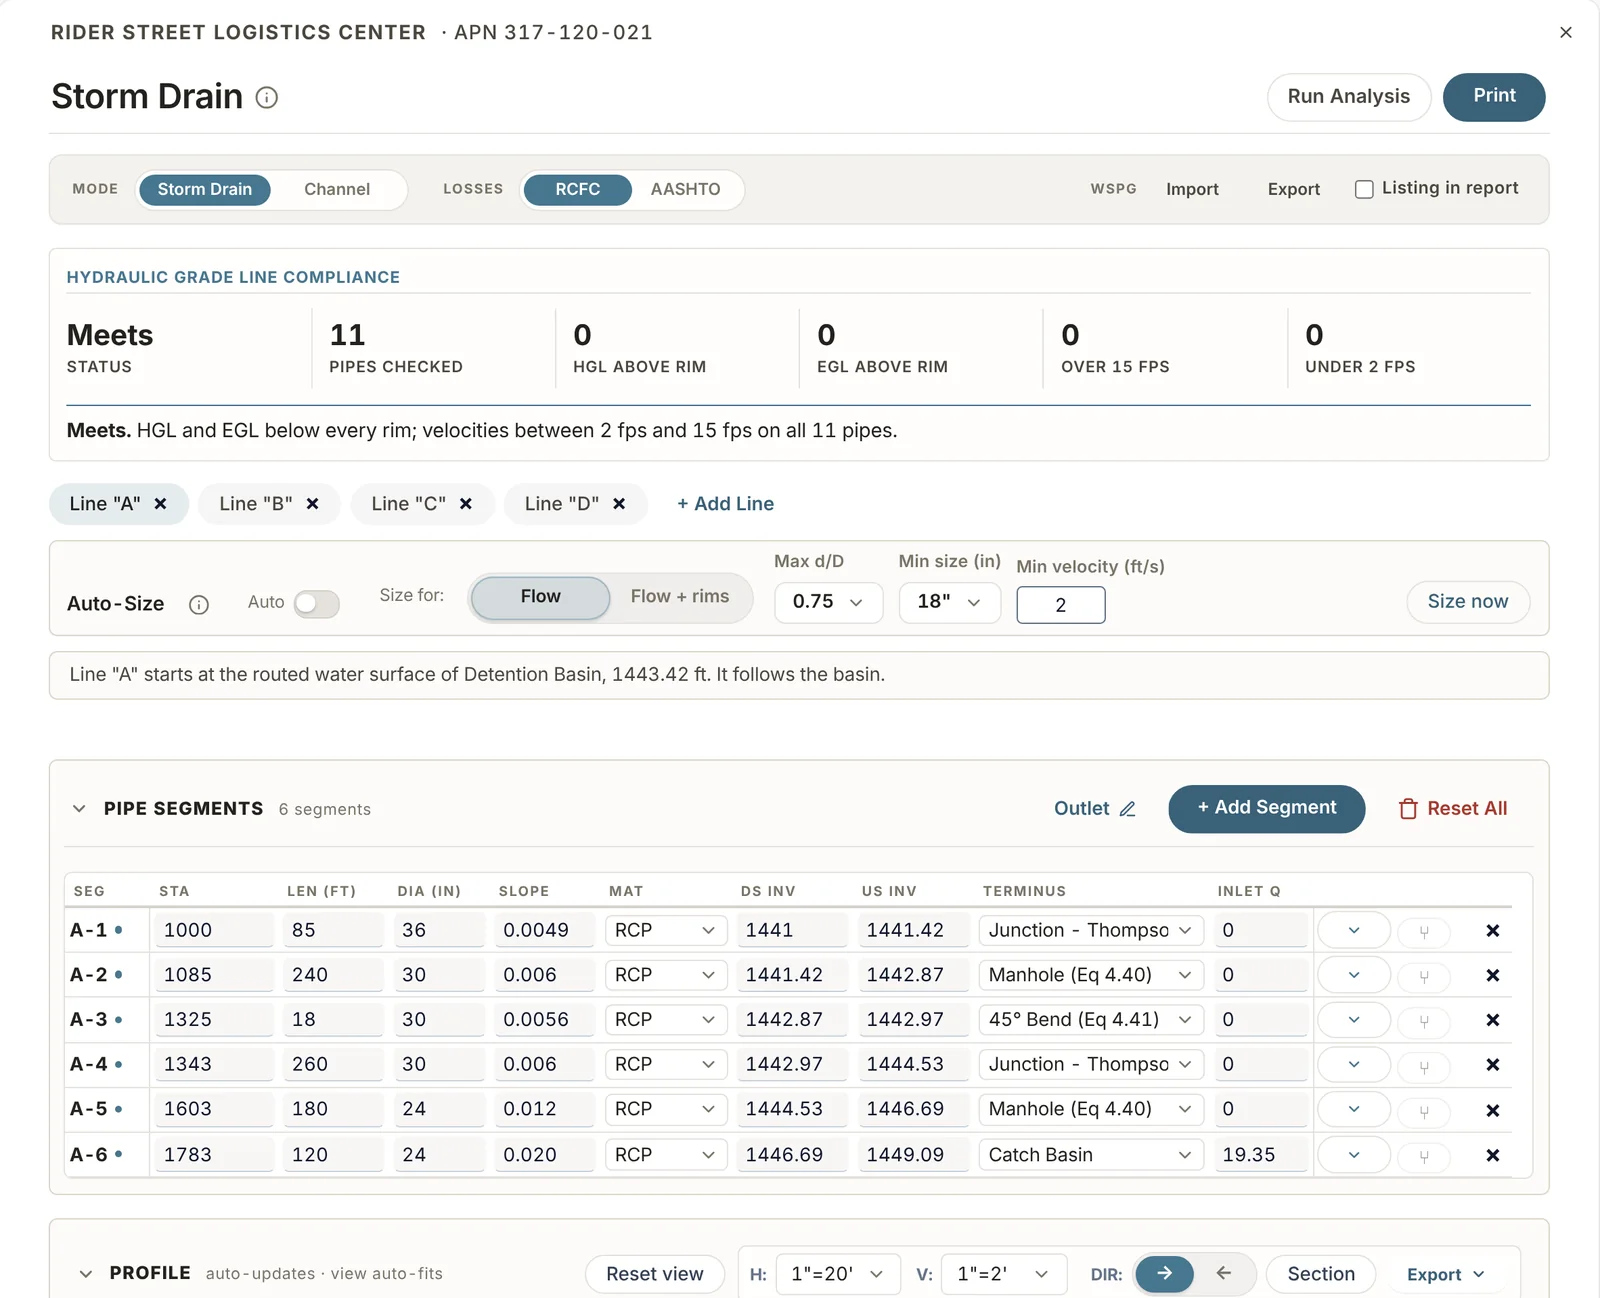
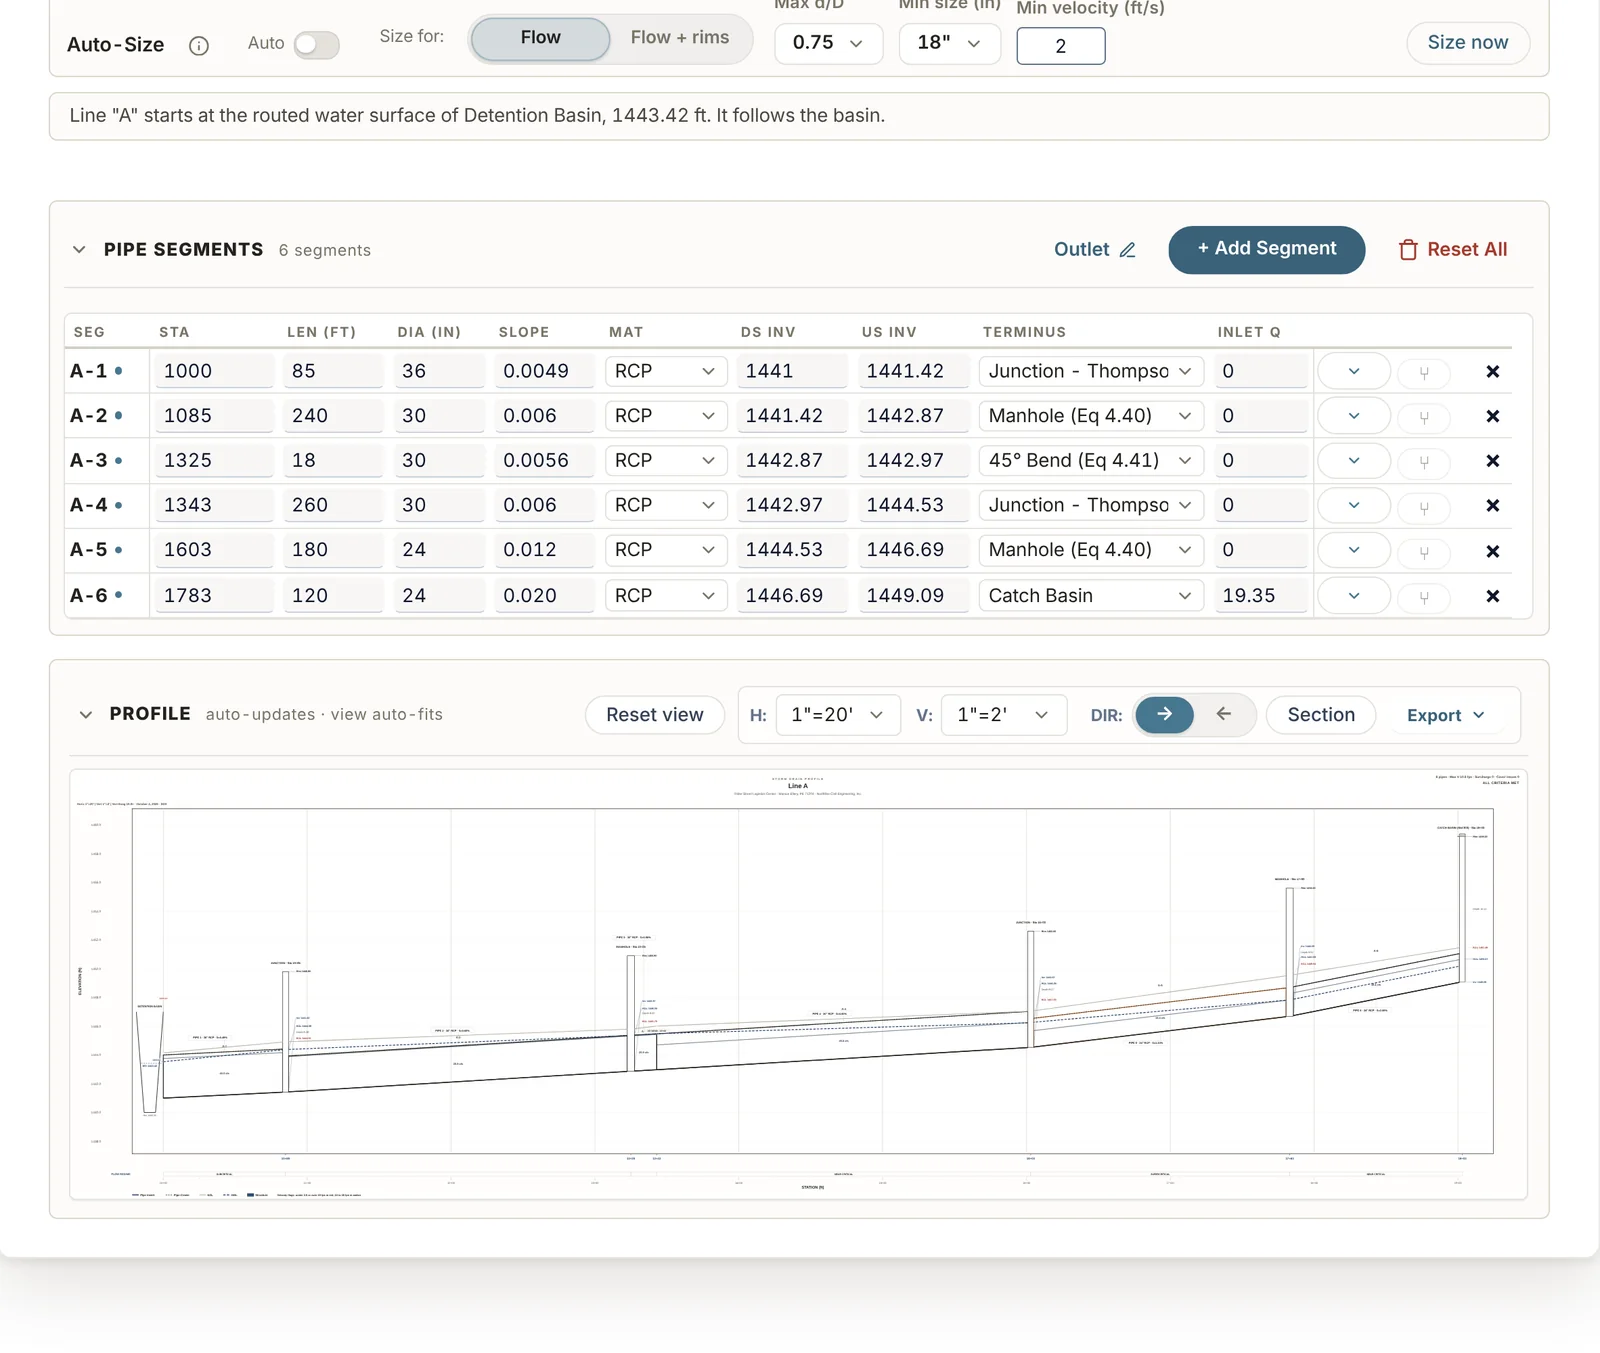
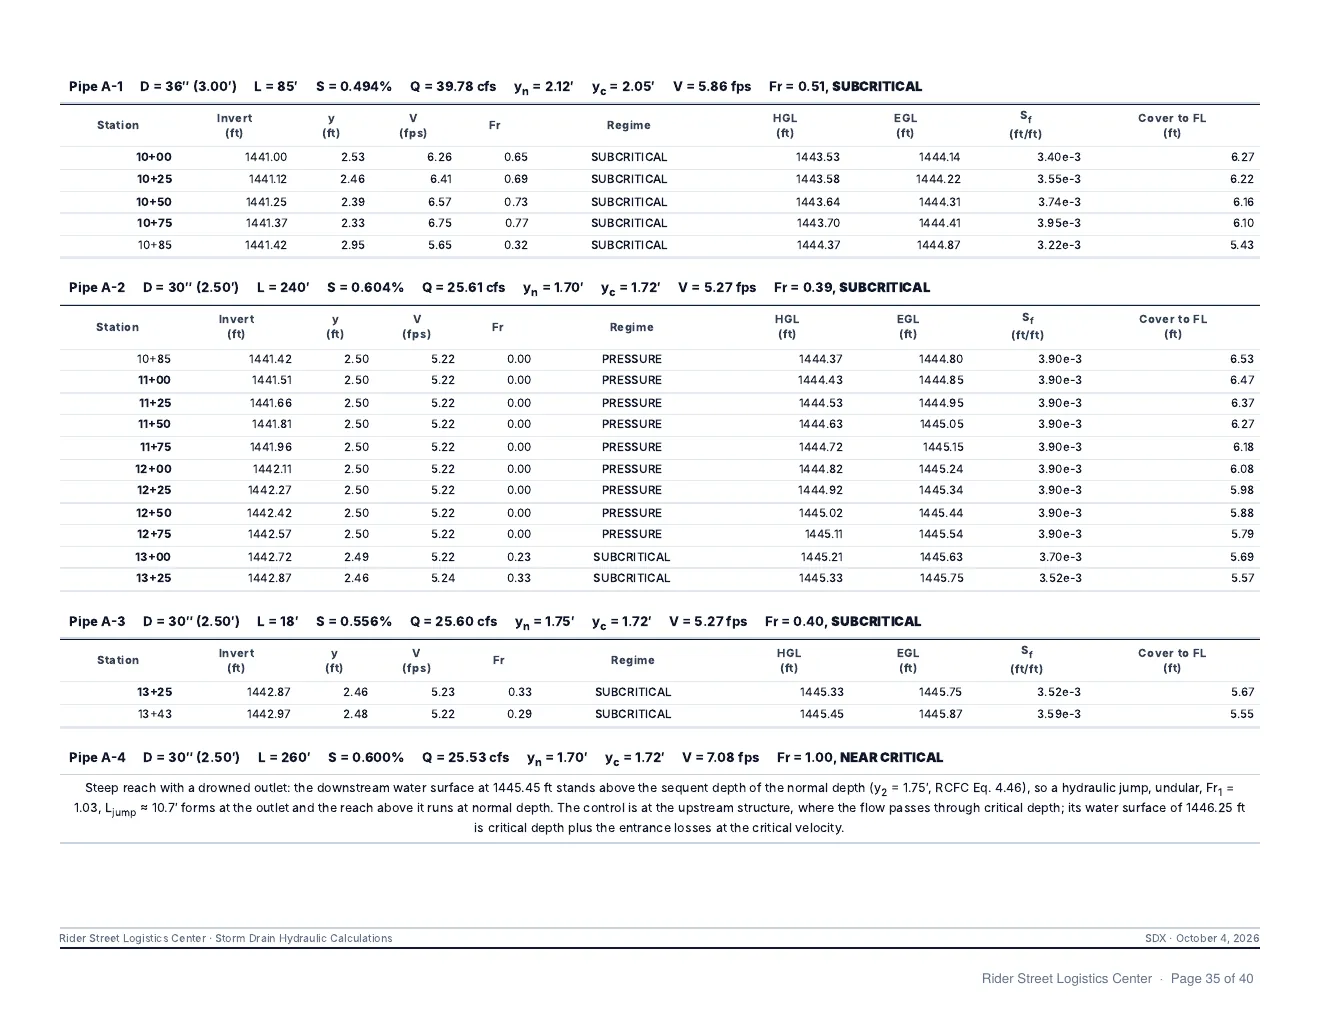
Hydraulic and energy grade lines for each storm drain line, by the RCFC Hydraulic Design Manual.
Grade lines
- Structure losses by the RCFC method, with Thompson's equation at junctions, or by the AASHTO method.
- Outlet conditions: free outfall, a starting water surface, a routed basin, or a junction with another line.
- Laterals start at the main line's grade line and add their flow to it.
- Flows come from the drainage areas in Hydrology.
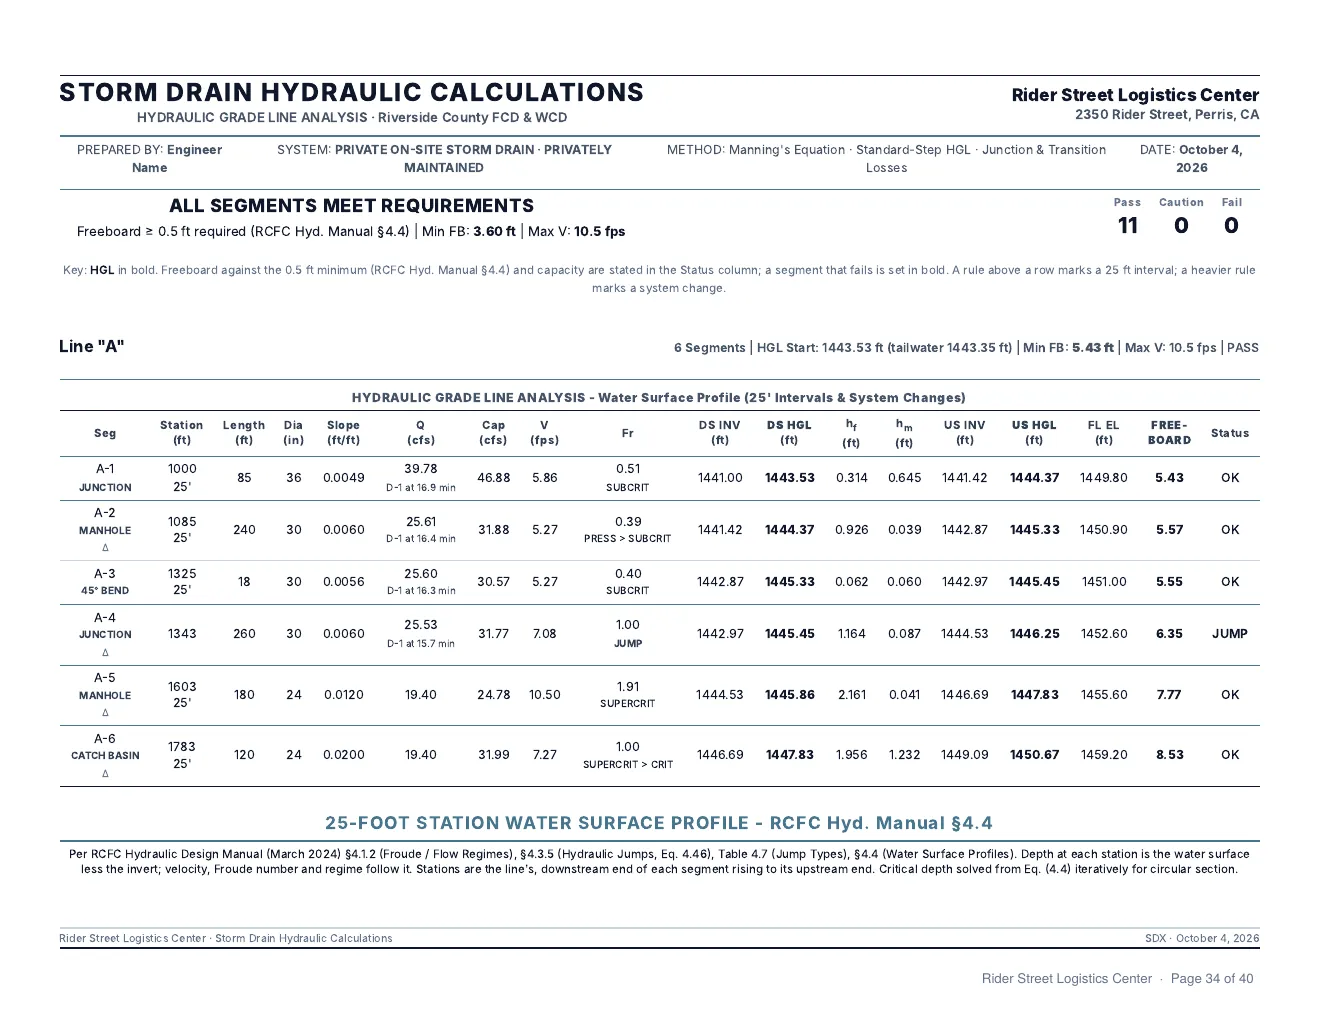
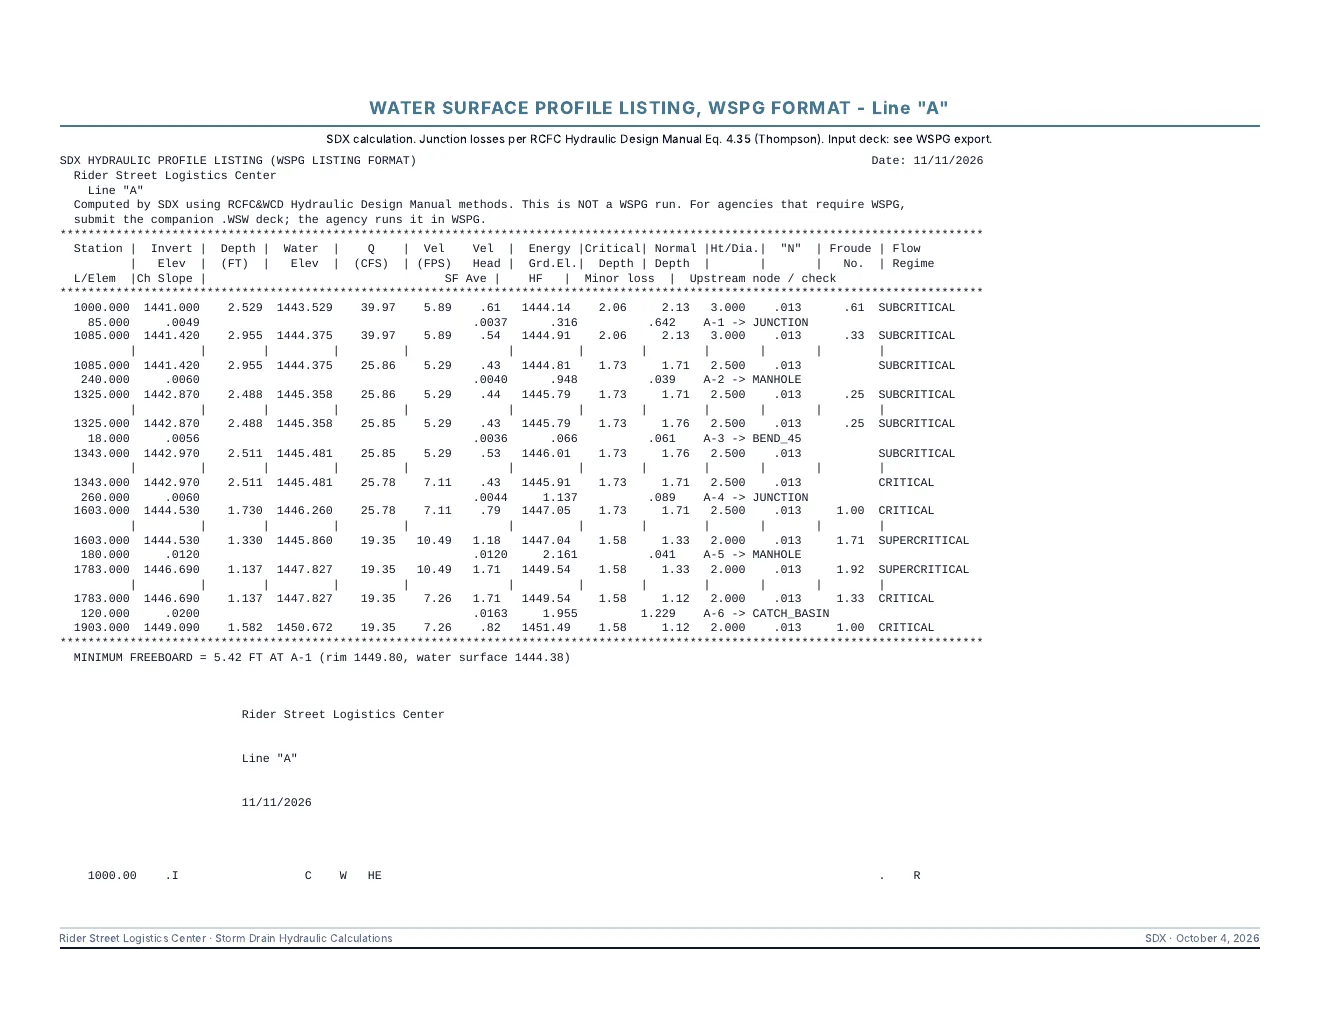
- A water surface profile is listed at 25-ft stations for each segment.
Pipes
- RCP, HDPE, PVC and CMP pipe, and reinforced concrete box.
- Auto-Size picks diameters from a maximum d/D, a minimum size and a minimum velocity.
- Sizing can also raise pipes until every grade line clears its rim.
- Existing pipes carry flow but are never resized.
Compliance panel
- Lists any hydraulic or energy grade line above a rim.
- Lists any velocity under 2 fps or over 15 fps.
- Each item names the line and station.
Profiles
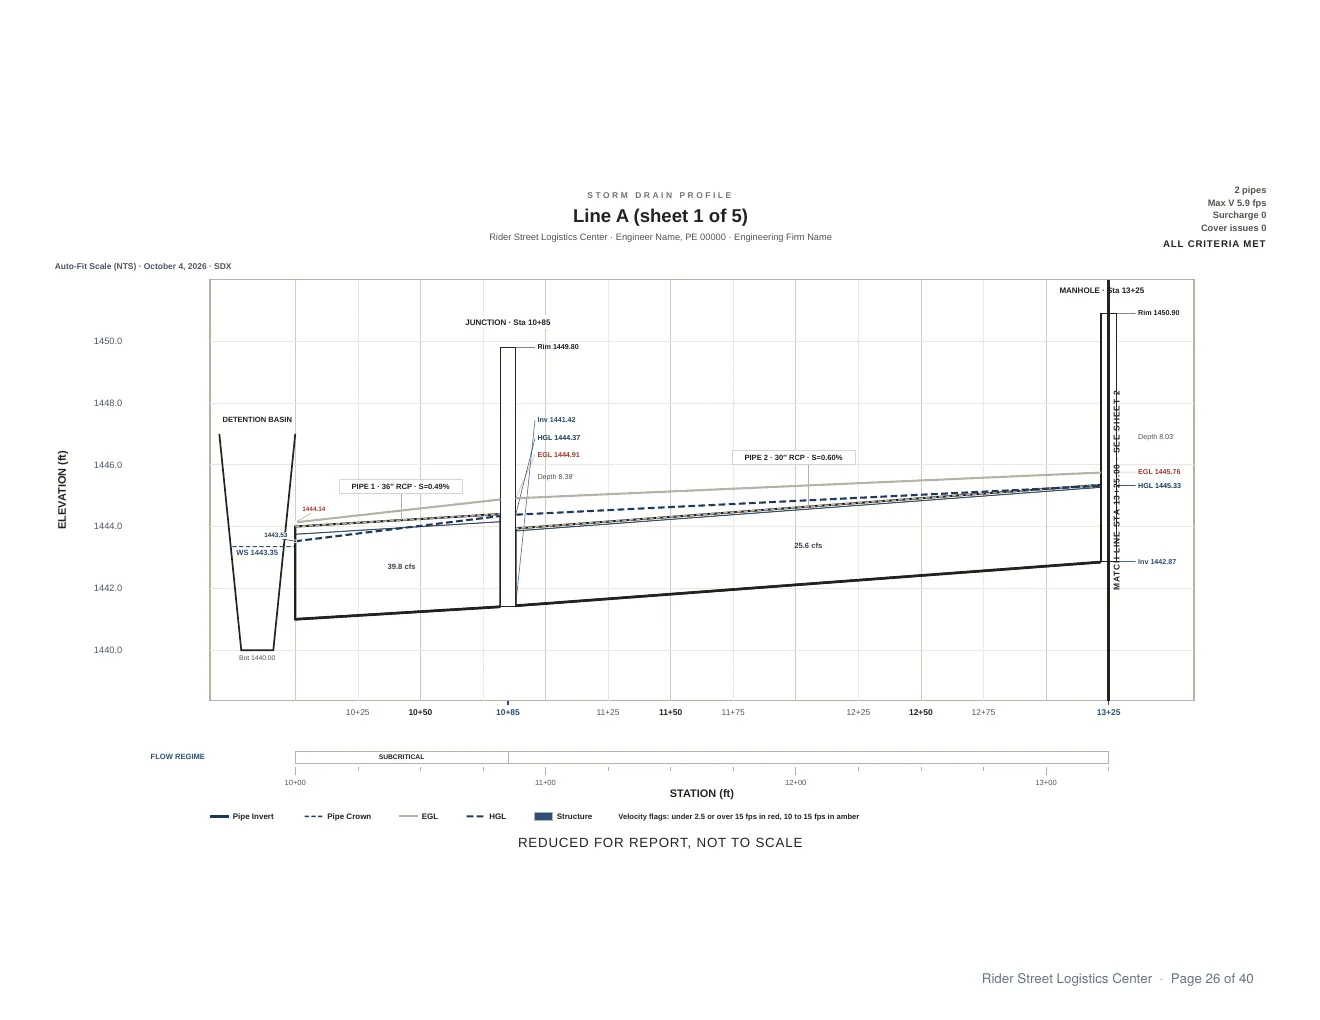
- The profile shows the pipe, structures and both grade lines.
- Labels can be dragged, and their positions are saved with the project.
- Prints as a report sheet or at full scale on 24x36 sheets.
- Exports to SVG and to DXF for CAD.
WSPG and plan import
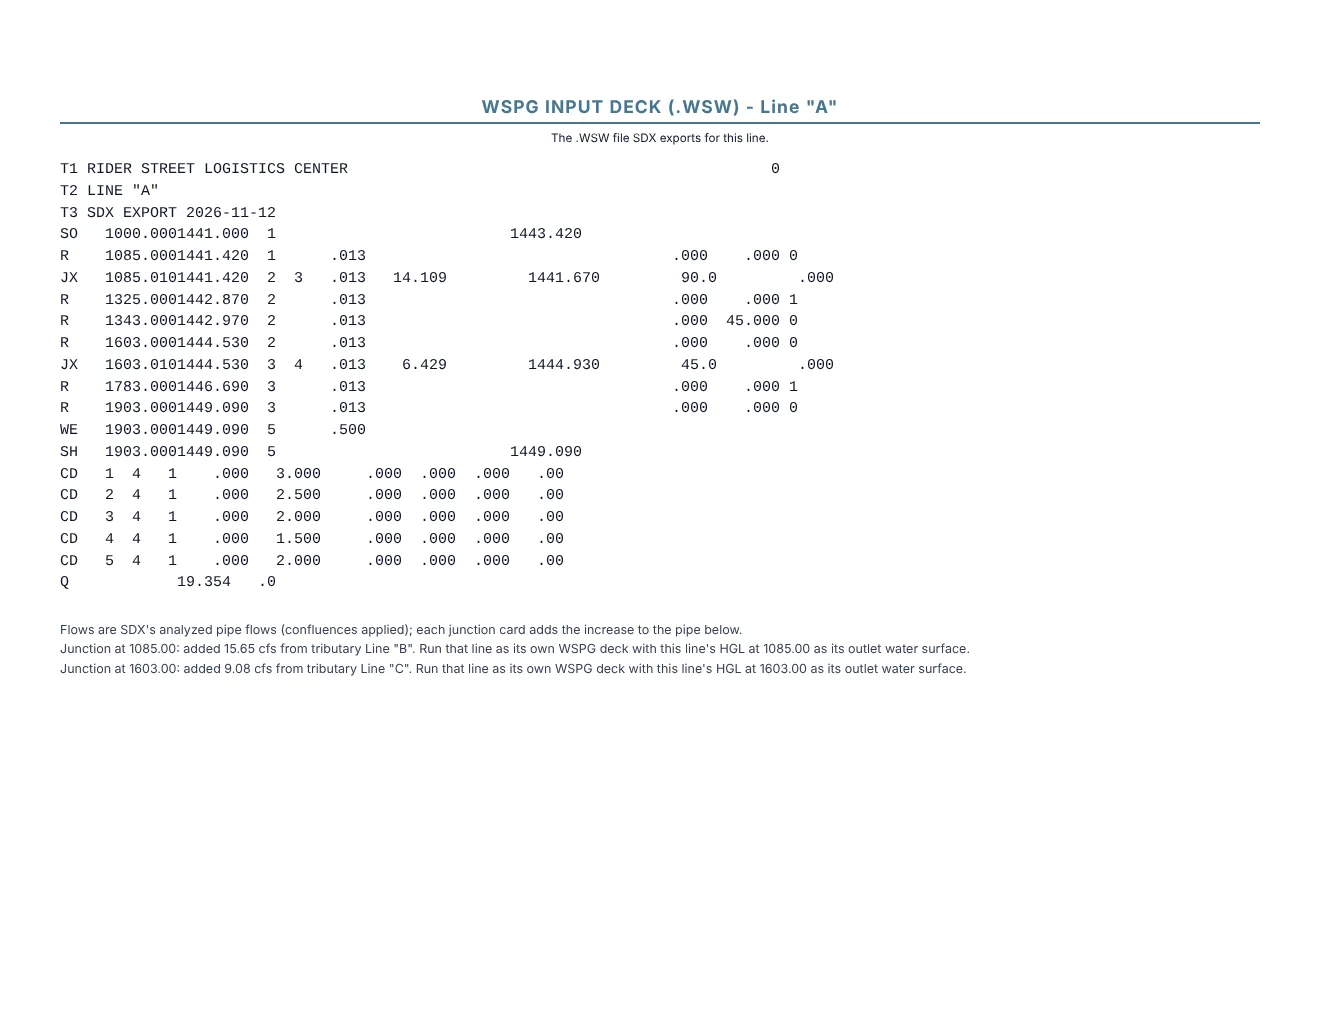
- Each line exports as a WSPG input deck.
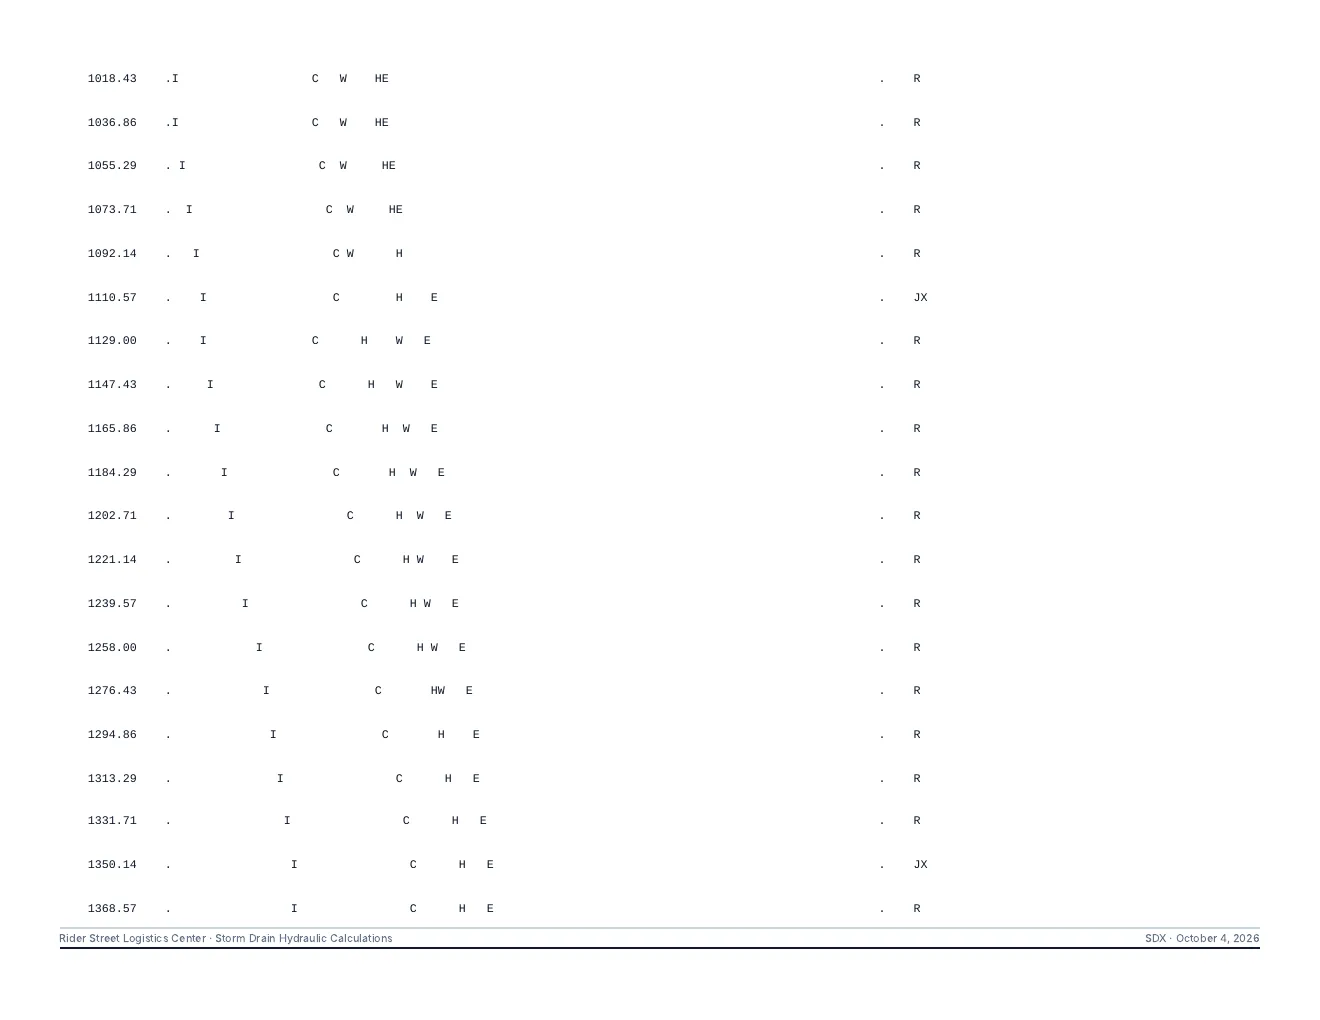
- Results also print in the WSPG listing layout, with the profile plot.
- In the Redlands Line A-2 test, SDX placed the hydraulic jump at station 101+56.03 and WSPG placed it at 101+55.99.
- WSPG decks can be imported as lines.
- Storm drain lines can be read from a PDF of the plans, with a review list before anything is added.
Report pages
Drainage Capacity
Capacity checks for inlets, streets and outlets, by HEC-22 methods.
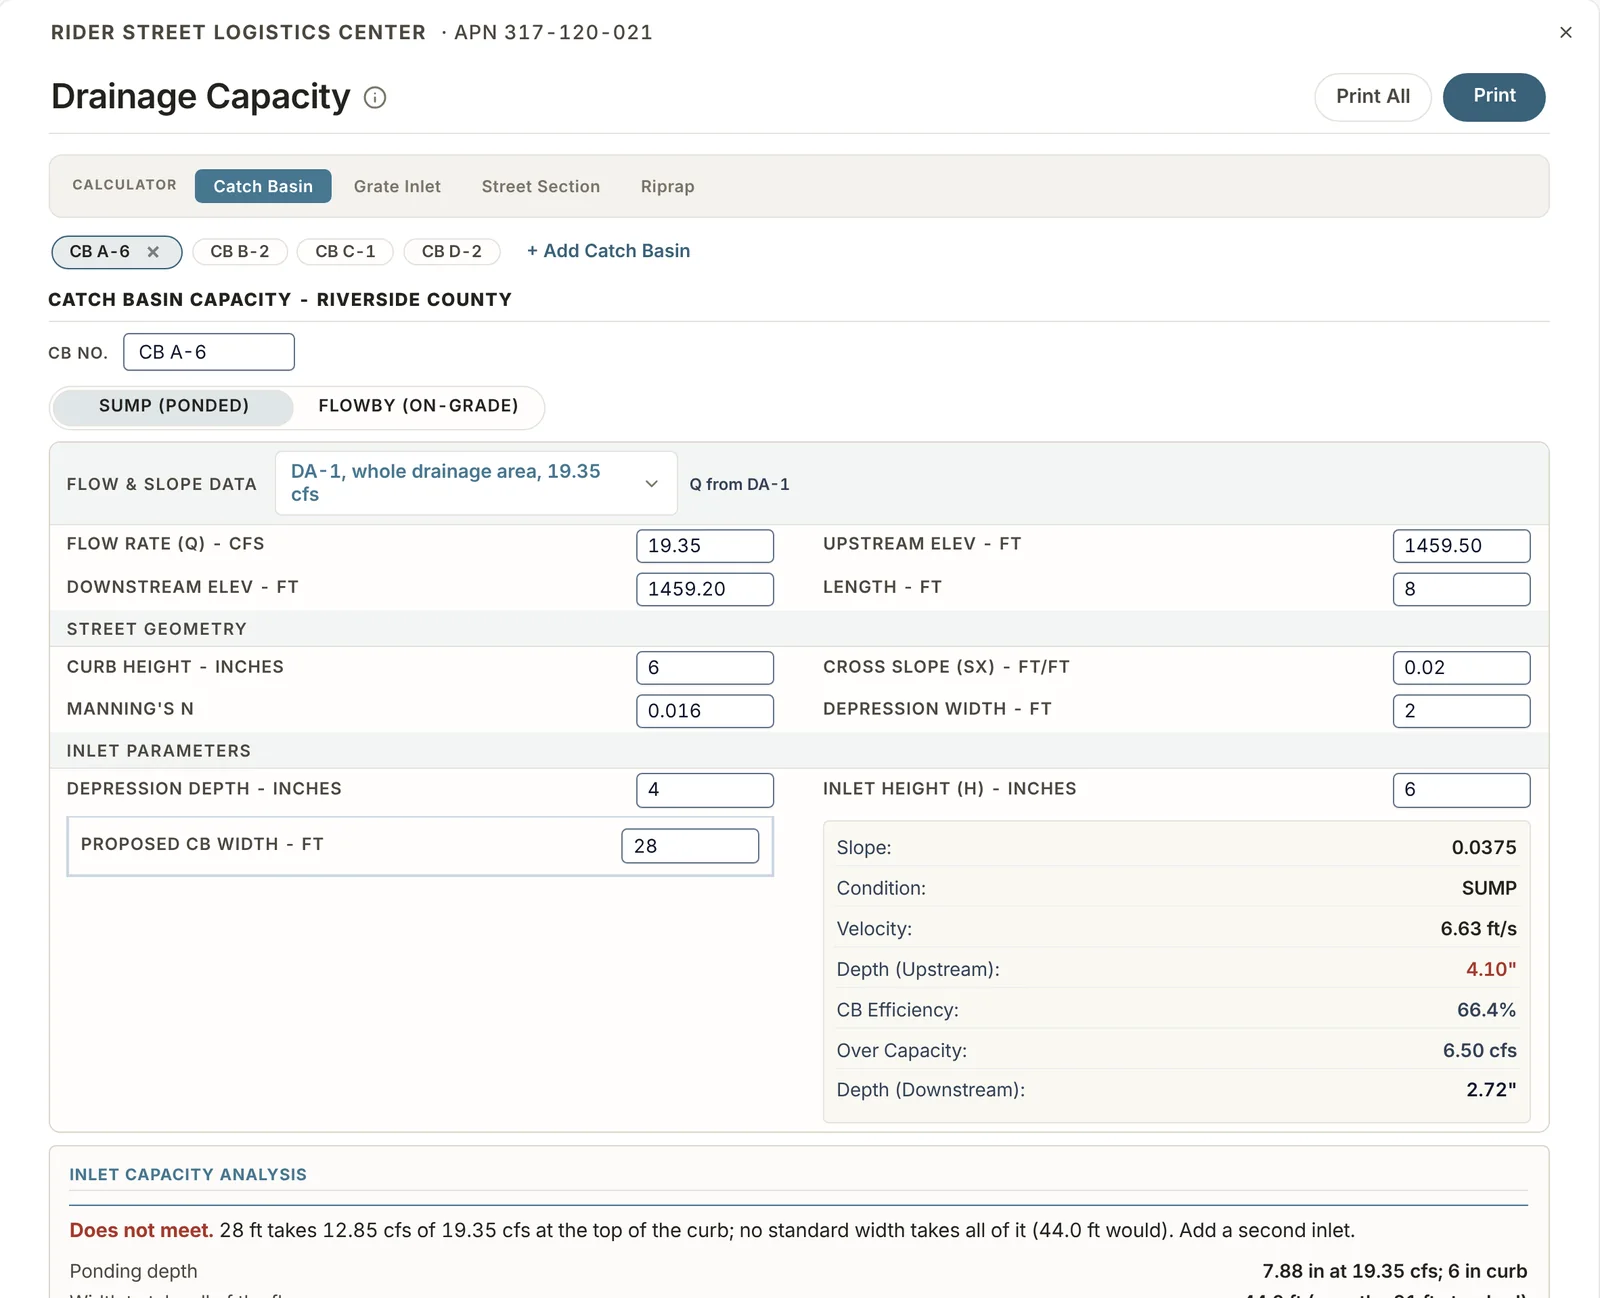
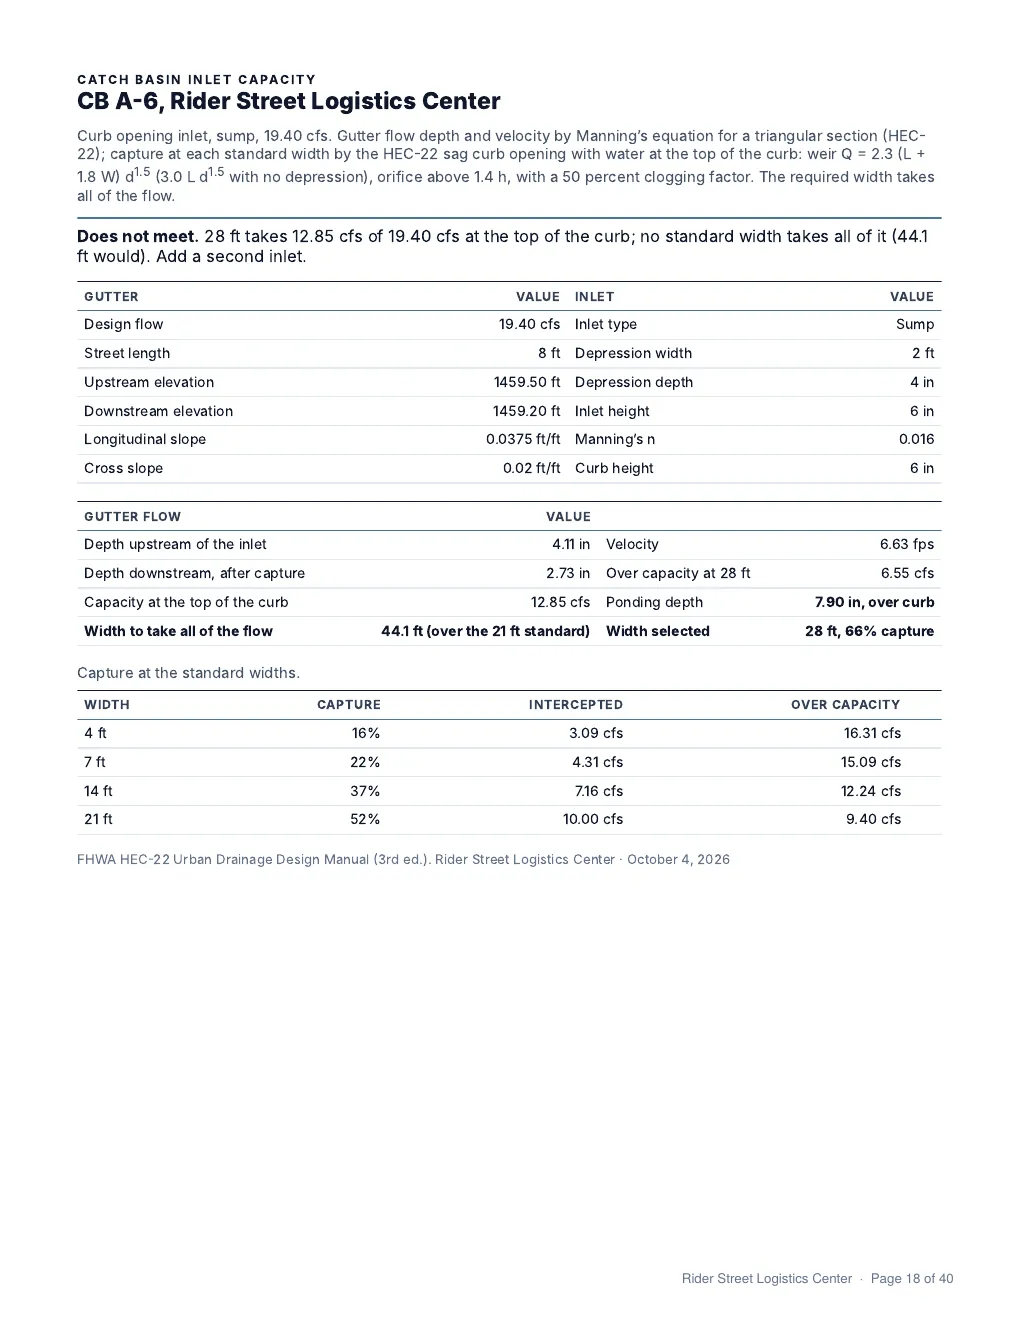
Catch basins
- Curb opening catch basins on grade and in sump.
- Results give depth, velocity, efficiency and the flow over capacity.
Grate inlets
- Drop inlet grates checked against the flow reaching them.
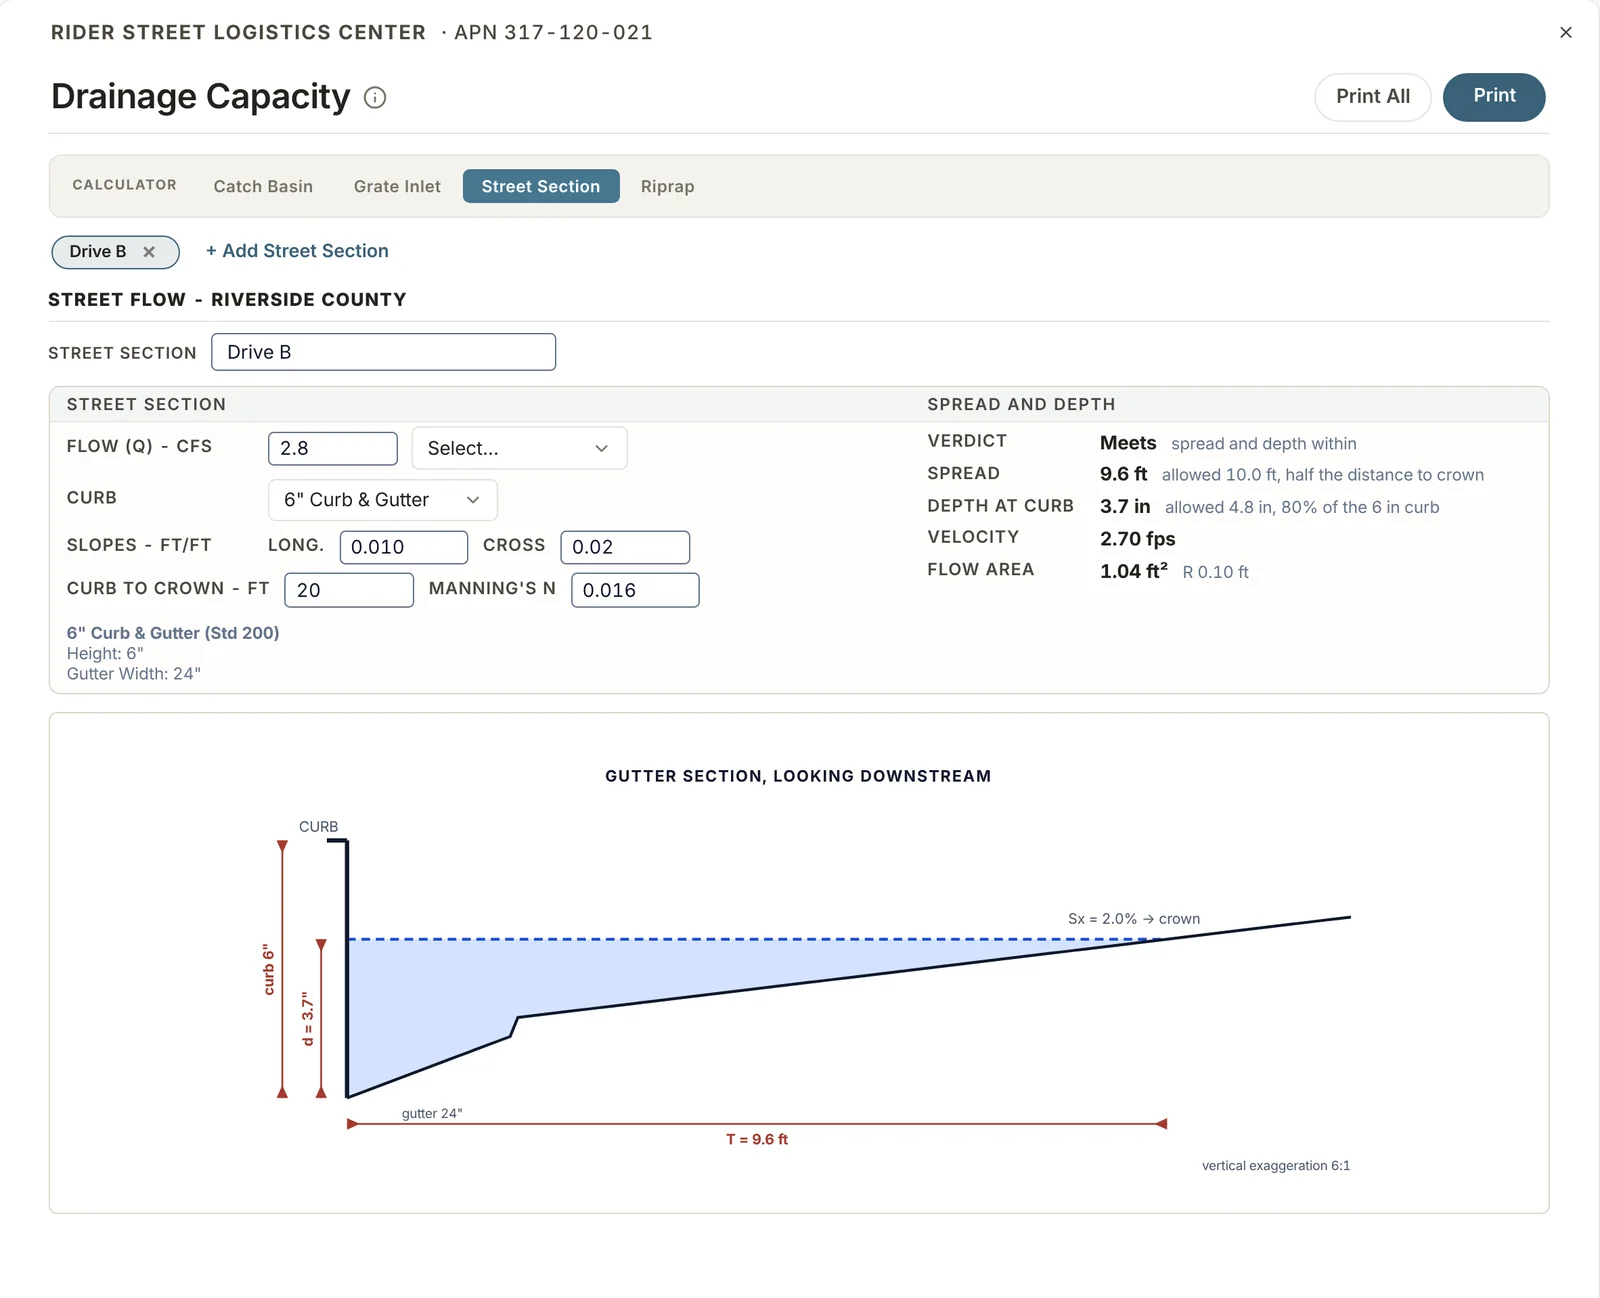
Street sections
- Spread and depth at the curb for a given flow, curb type and street slopes.
- The result is compared with the allowed spread and depth.
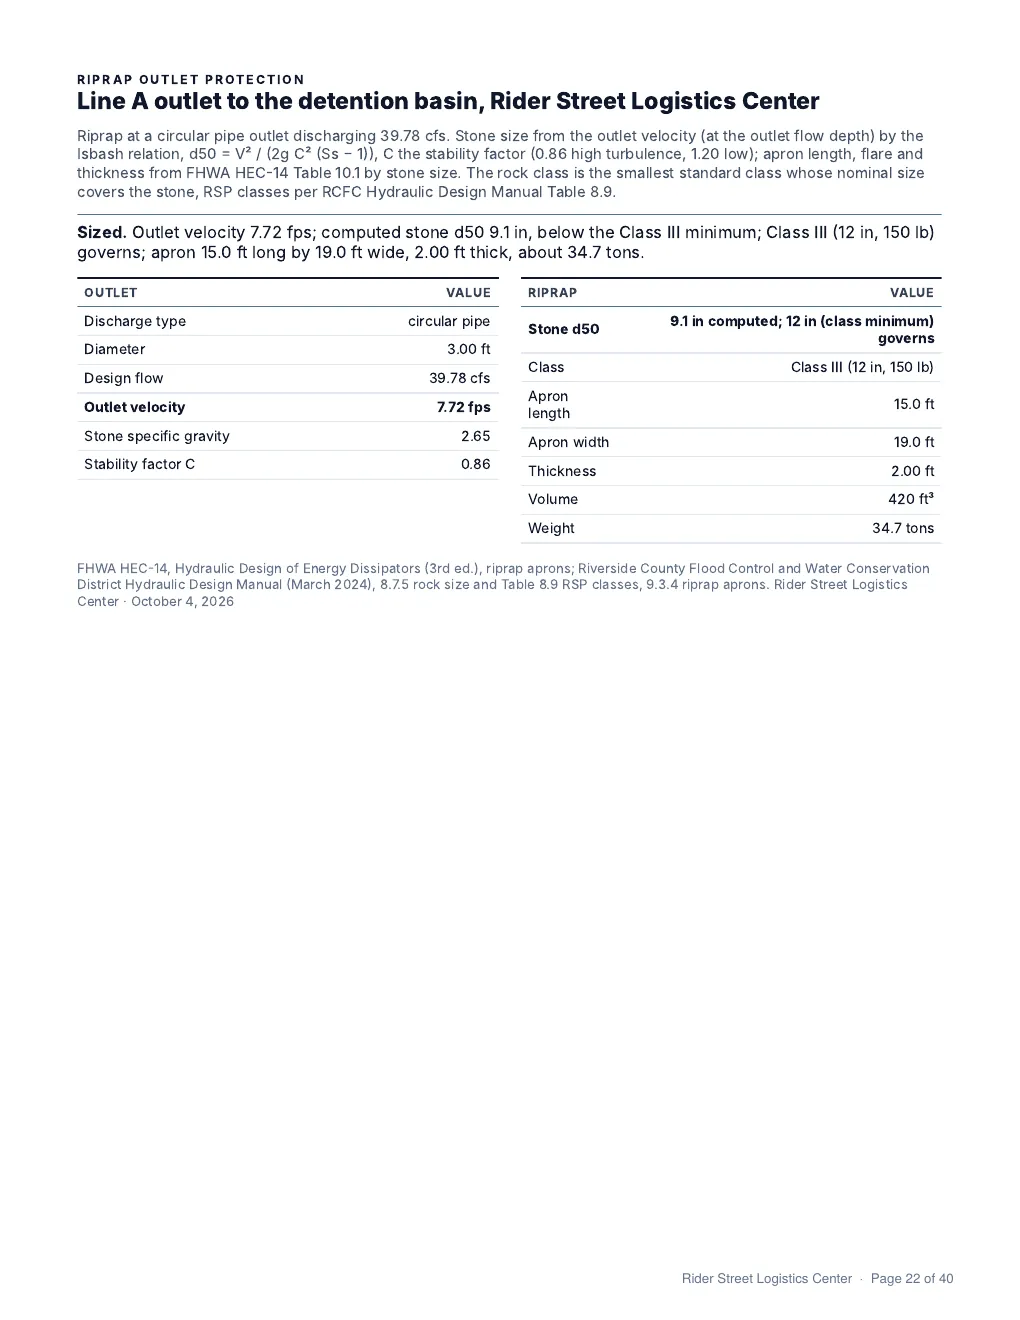
Riprap
- Outlet protection sized from the outlet flow and velocity.
- Results give stone size and class, apron dimensions and quantity.
Report pages
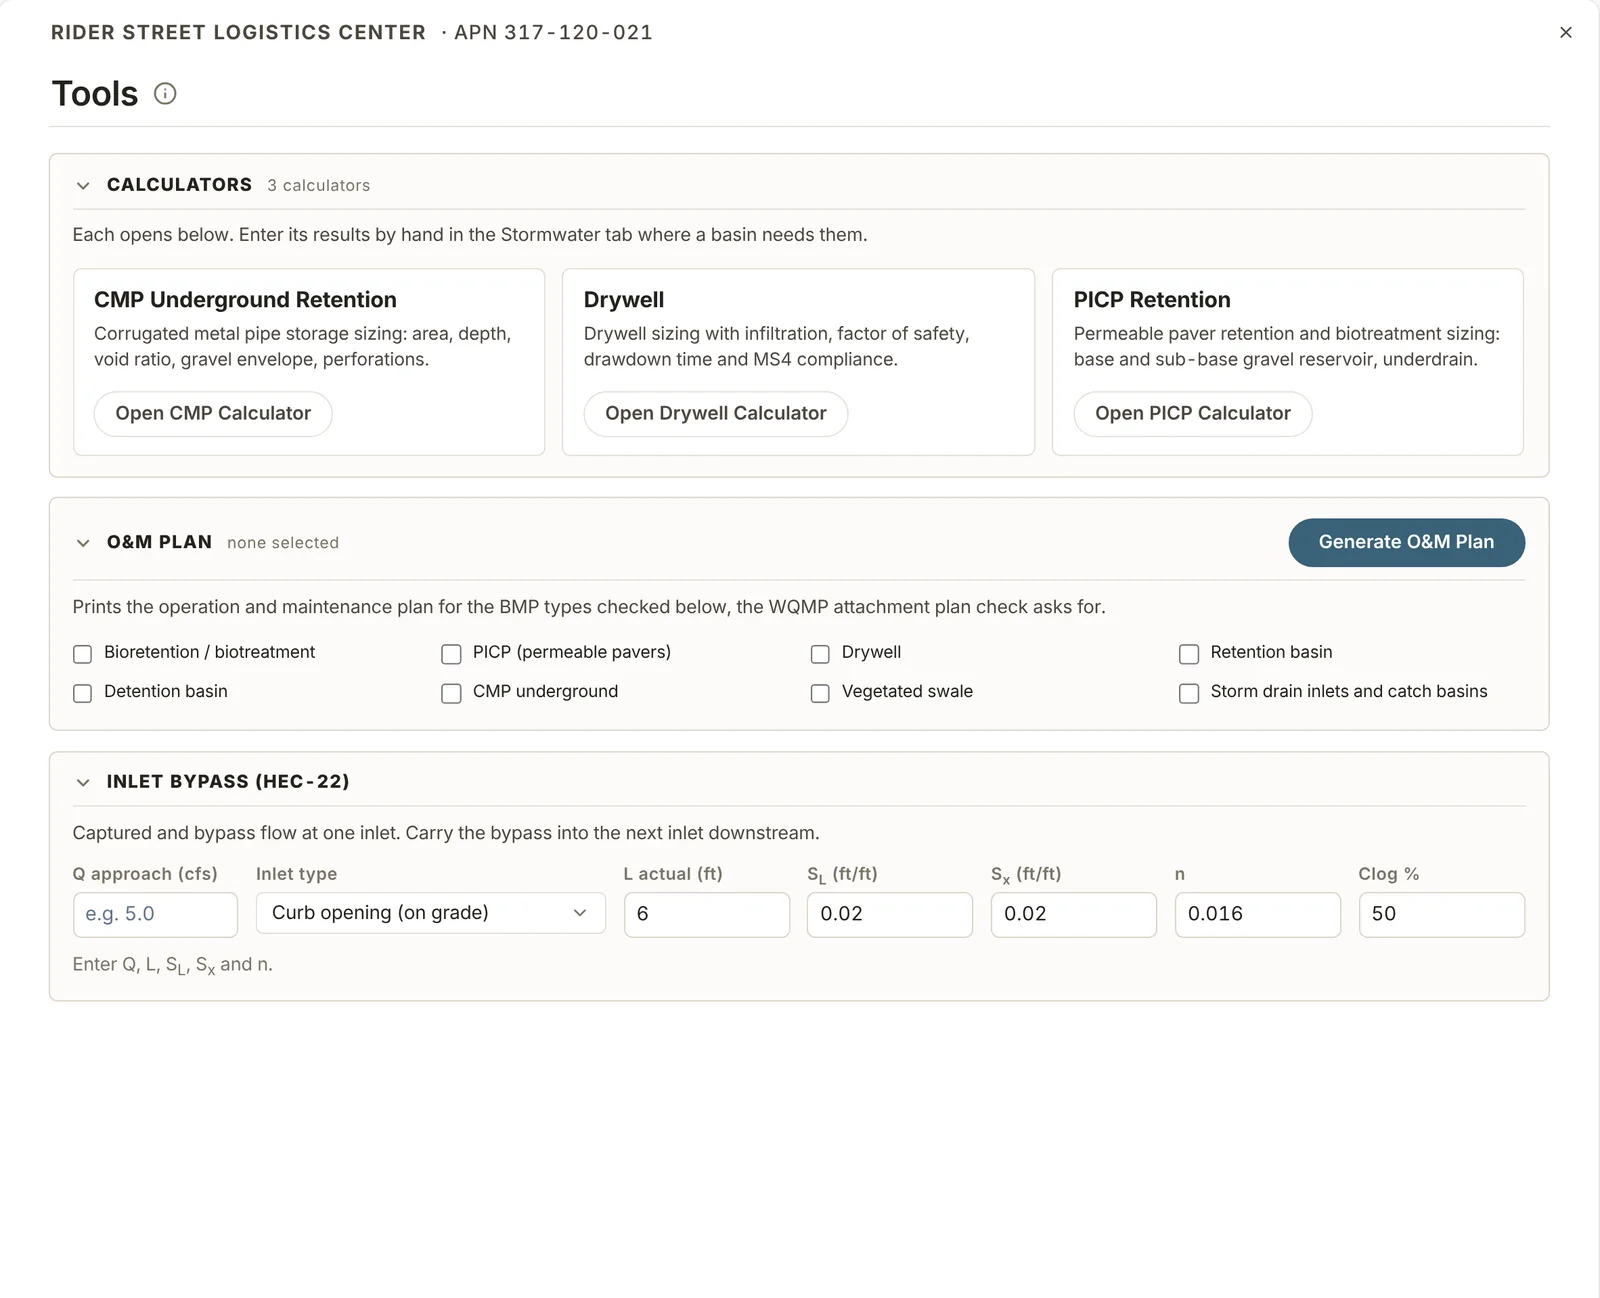
Tools
Calculators and documents that sit outside the main apps.
Calculators
- CMP underground retention.
- Drywells.
- Permeable pavers (PICP).
O&M plan
- Writes the operation and maintenance plan for the BMPs selected on the project.
Inlet bypass
- Captured and bypass flow for inlets in series on grade, by HEC-22.
- The bypass from one inlet carries to the next inlet downstream.
Reports
The hydrology study prints as one PDF.
Contents
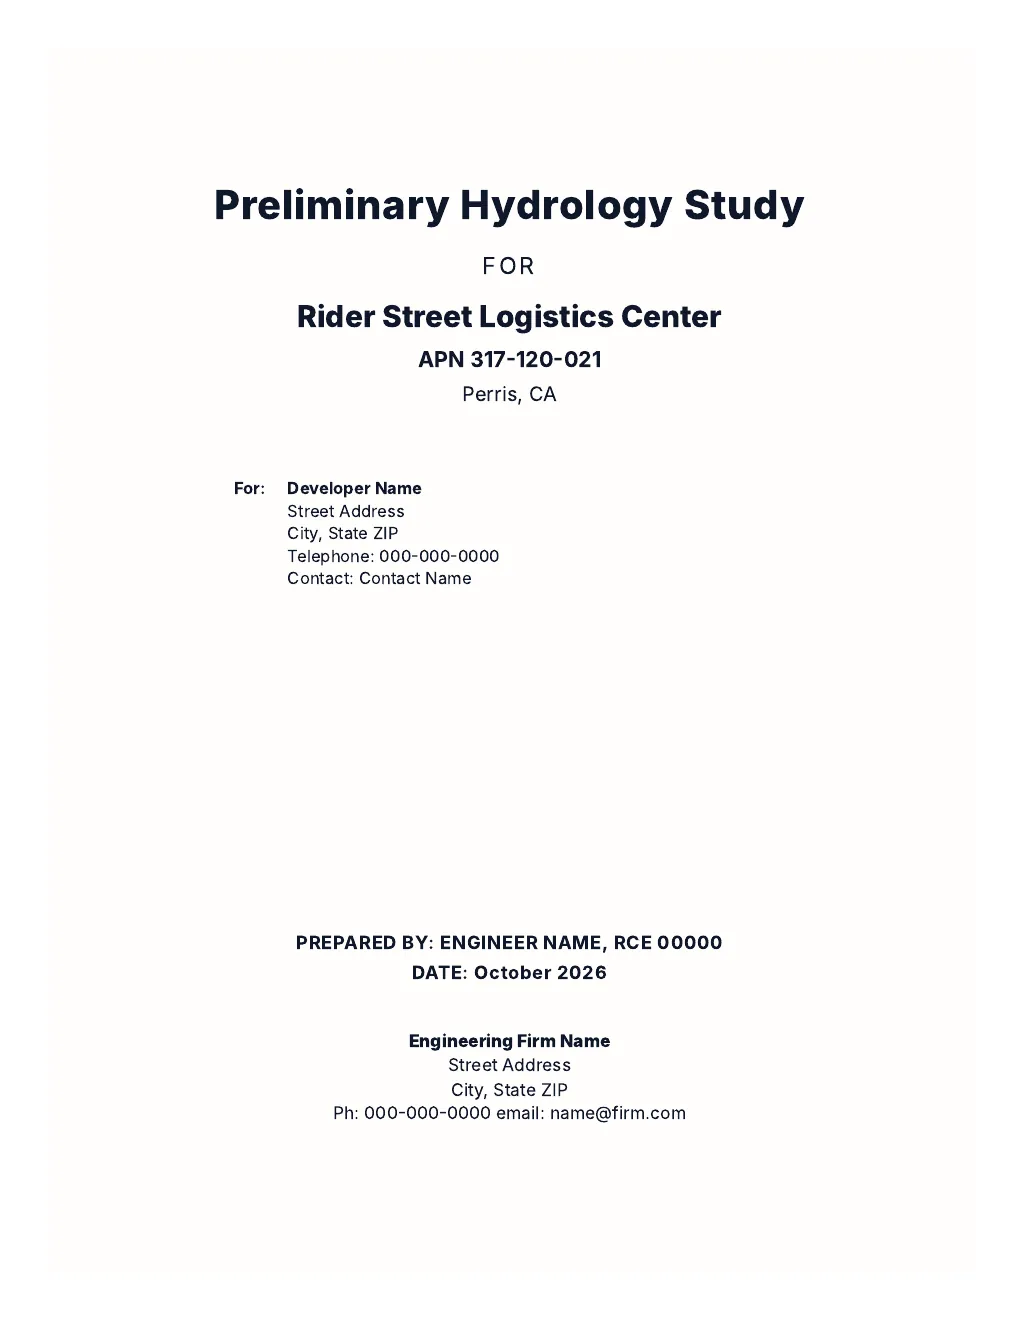
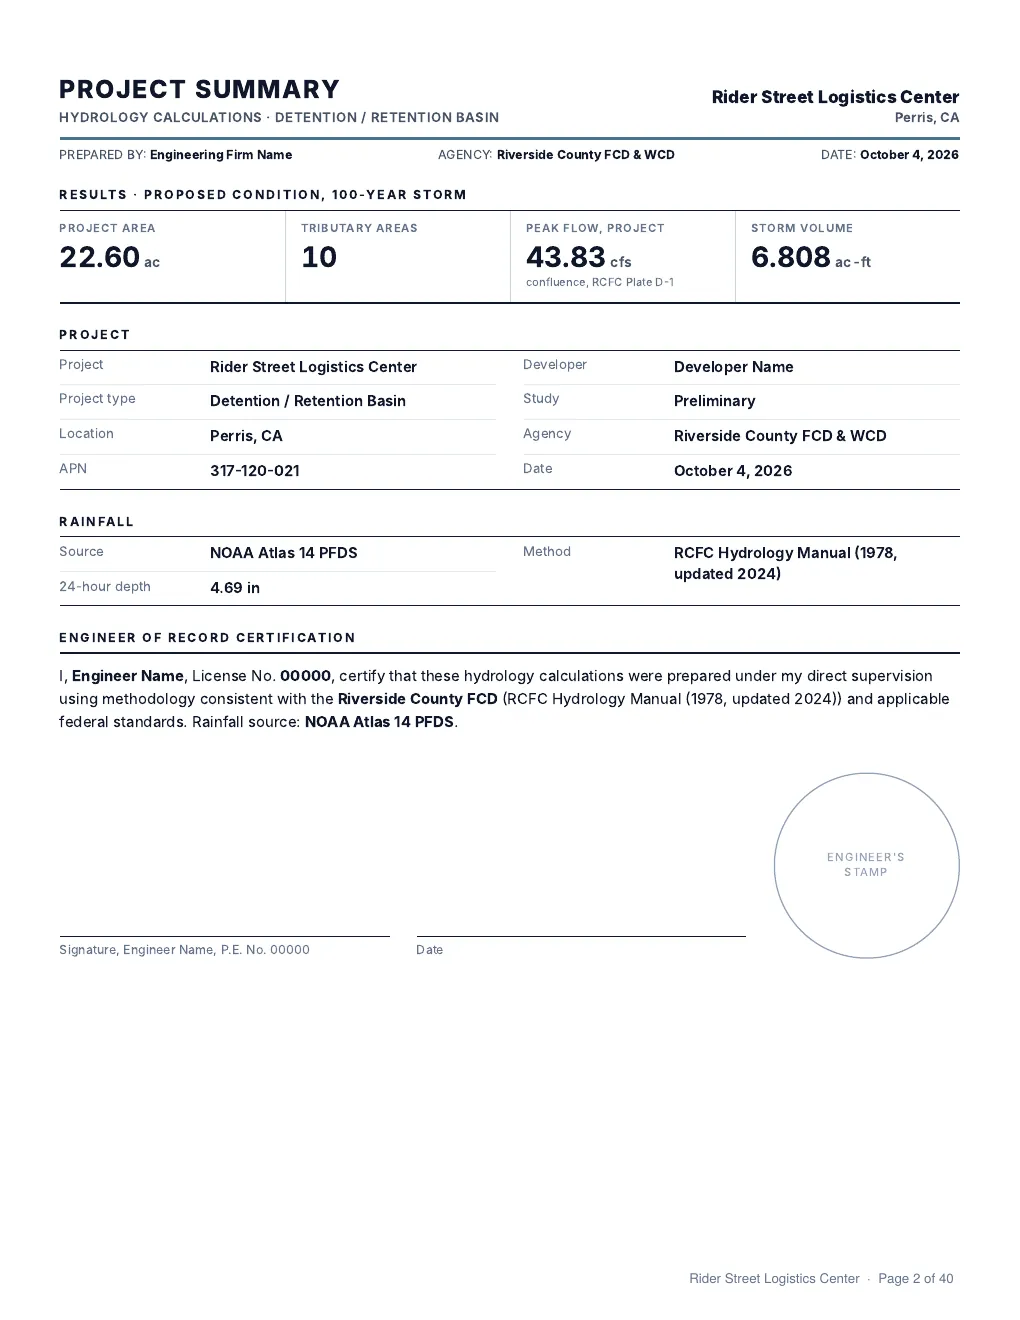
- Cover, project summary, narrative, site exhibits, calculations, profiles and appendices.
- Vicinity, soils and FEMA flood maps are generated from the APN.
- Long storm drain profiles print on several sheets with match lines.
Narrative
- Written from the entries in Project Setup.
- Any section can be edited before printing.
Before submittal
- A 32-item checklist shows what is still missing.
- The firm name and address on the license print on every report.
- Trial printouts are marked Not for Submittal.
Units
- Projects can be in US or metric units.
Sample report

SDX has a 14-day free trial. Trial printouts are marked Not for Submittal. Start a free trial